WTI Crude Oil (1H) Chart Analysis with Emojis:
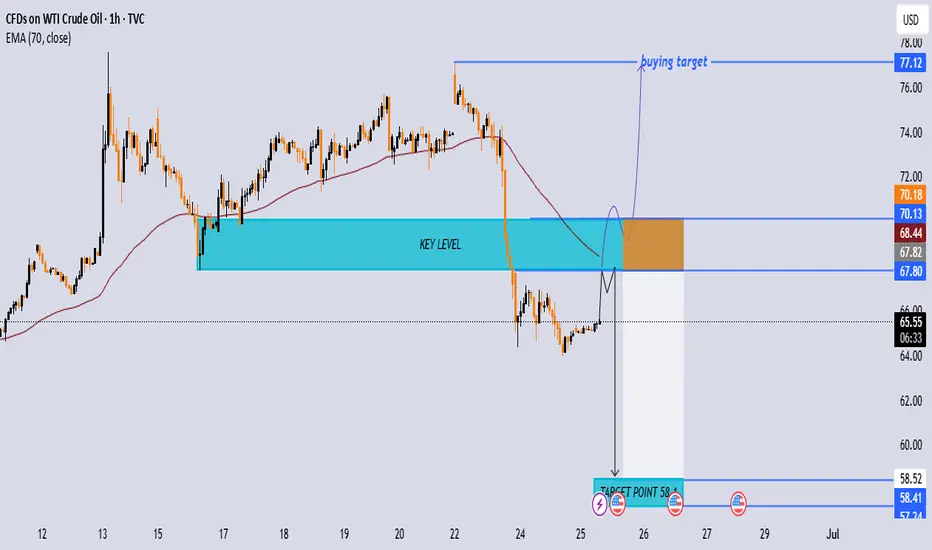
🔵 Key Level Zone (67.80 - 70.18 USD)
👉 Major decision area — 🔥 Watch for reaction!
⚠️ Potential for price rejection here.
🔻 Primary Bearish Scenario:
🔵 Price moves up to Key Level zone (Blue Box).
🔴 Red Dot — Entry for potential Sell if rejection confirmed.
🎯 Target Point: 58.1 USD marked with a 🎯 and 🔵 Blue Dot.
💡 Historical support zone here.
Alternate Bullish Scenario:
✅ Break above 70.18 USD with strong momentum.
🟢 Green Dot — Entry confirmation above resistance.
📈 Buying Target: 77.12 USD marked and 🔵 Blue Dot.
Key Indicators:
📏 EMA 70 (68.44 USD) — Dynamic resistance, price may react here.
👀 Price hovering below — indicating bearish bias unless broken.
Trade Tips:
✔️ Wait for rejection at Key Zone for sell setup 🔻.
✔️ Break & retest above 70.18 USD for potential buy setup 🔼.
✔️ Use stop-loss to manage risk.
join my tellegram channel
t.me/+yhY0QtYtM0g0NWM0
join my refferal broker
one.exnesstrack.org/a/g565sj1uo7?source=app
t.me/+yhY0QtYtM0g0NWM0
join my refferal broker
one.exnesstrack.org/a/g565sj1uo7?source=app
פרסומים קשורים
כתב ויתור
המידע והפרסומים אינם אמורים להיות, ואינם מהווים, עצות פיננסיות, השקעות, מסחר או סוגים אחרים של עצות או המלצות שסופקו או מאושרים על ידי TradingView. קרא עוד בתנאים וההגבלות.