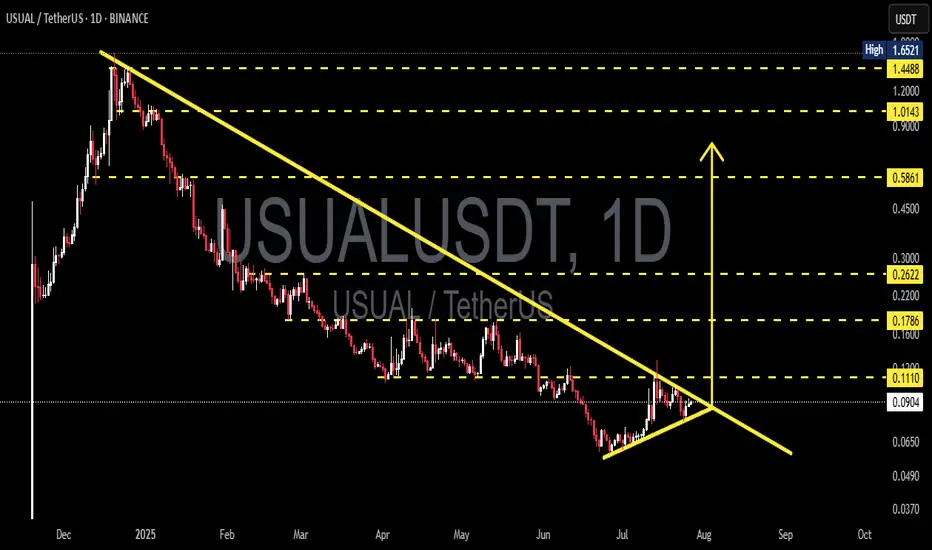
USUALUSDT is currently displaying a very compelling technical structure on the daily timeframe. After a long downtrend since early 2025, the price is now forming an accumulation pattern with increasing buying pressure.
---
📊 Pattern & Chart Structure Overview:
🔹 Descending Triangle Formation:
The price has been forming a series of lower highs with a gradually rising base, indicating a classic compression or accumulation pattern that often precedes a major breakout.
🔹 Rising Buying Pressure:
Notice the formation of higher lows since early July—this suggests that buyers are gradually stepping in, despite the macro downtrend still intact.
🔹 Low Volume = High Breakout Potential:
Volume remains relatively low, which is typical in the final stages of consolidation. Once a breakout occurs, it’s likely to be accompanied by a significant spike in volume.
---
🟢 Bullish Scenario (Confirmed Breakout):
If the price breaks above the descending trendline (~0.1110) with a strong daily candle and increased volume, it may ignite a bullish move with the following targets:
🎯 Upside Targets:
1. 0.1786 – Previous consolidation resistance
2. 0.2622 – Psychological zone and prior seller control area
3. 0.5861 – Medium-term target if momentum builds
4. 1.0143 and 1.4488 – Long-term bullish targets upon full trend reversal
🚀 The upside potential is massive as the price has a lot of room above once resistance is broken.
---
🔴 Bearish Scenario (Failed Breakout):
If the price gets rejected at the descending resistance and breaks down below the ascending support:
📉 Downside Targets:
1. 0.0650 – Minor support from July's accumulation zone
2. 0.0490 – 0.0370 – Previous cycle lows and potential bounce zones
⚠️ A breakdown would invalidate the current accumulation setup and suggest sellers still dominate.
---
🔍 Conclusion & Strategy:
USUALUSDT is now at a critical decision zone. The combination of a descending triangle, rising higher lows, and low volume makes it clear that a major move is brewing.
📌 Breakout = Big swing trade opportunity
📌 Breakdown = Avoid entries, wait for lower support zones
---
📈 Trader Recommendations:
✅ Set alerts above 0.1110
✅ Confirm breakout with strong candle + volume
✅ Aggressive stop loss below 0.0750
✅ Swing trade targets based on historical resistance & fib levels
#USUALUSDT #CryptoBreakout #AltcoinSetup #DescendingTriangle #CryptoAnalysis #BullishSetup #BearishSetup #BreakoutIncoming #TechnicalAnalysis
---
📊 Pattern & Chart Structure Overview:
🔹 Descending Triangle Formation:
The price has been forming a series of lower highs with a gradually rising base, indicating a classic compression or accumulation pattern that often precedes a major breakout.
🔹 Rising Buying Pressure:
Notice the formation of higher lows since early July—this suggests that buyers are gradually stepping in, despite the macro downtrend still intact.
🔹 Low Volume = High Breakout Potential:
Volume remains relatively low, which is typical in the final stages of consolidation. Once a breakout occurs, it’s likely to be accompanied by a significant spike in volume.
---
🟢 Bullish Scenario (Confirmed Breakout):
If the price breaks above the descending trendline (~0.1110) with a strong daily candle and increased volume, it may ignite a bullish move with the following targets:
🎯 Upside Targets:
1. 0.1786 – Previous consolidation resistance
2. 0.2622 – Psychological zone and prior seller control area
3. 0.5861 – Medium-term target if momentum builds
4. 1.0143 and 1.4488 – Long-term bullish targets upon full trend reversal
🚀 The upside potential is massive as the price has a lot of room above once resistance is broken.
---
🔴 Bearish Scenario (Failed Breakout):
If the price gets rejected at the descending resistance and breaks down below the ascending support:
📉 Downside Targets:
1. 0.0650 – Minor support from July's accumulation zone
2. 0.0490 – 0.0370 – Previous cycle lows and potential bounce zones
⚠️ A breakdown would invalidate the current accumulation setup and suggest sellers still dominate.
---
🔍 Conclusion & Strategy:
USUALUSDT is now at a critical decision zone. The combination of a descending triangle, rising higher lows, and low volume makes it clear that a major move is brewing.
📌 Breakout = Big swing trade opportunity
📌 Breakdown = Avoid entries, wait for lower support zones
---
📈 Trader Recommendations:
✅ Set alerts above 0.1110
✅ Confirm breakout with strong candle + volume
✅ Aggressive stop loss below 0.0750
✅ Swing trade targets based on historical resistance & fib levels
#USUALUSDT #CryptoBreakout #AltcoinSetup #DescendingTriangle #CryptoAnalysis #BullishSetup #BearishSetup #BreakoutIncoming #TechnicalAnalysis
✅ Get Free Signals! Join Our Telegram Channel Here: t.me/TheCryptoNuclear
✅ Twitter: twitter.com/crypto_nuclear
✅ Join Bybit : partner.bybit.com/b/nuclearvip
✅ Benefits : Lifetime Trading Fee Discount -50%
✅ Twitter: twitter.com/crypto_nuclear
✅ Join Bybit : partner.bybit.com/b/nuclearvip
✅ Benefits : Lifetime Trading Fee Discount -50%
כתב ויתור
המידע והפרסומים אינם אמורים להיות, ואינם מהווים, עצות פיננסיות, השקעות, מסחר או סוגים אחרים של עצות או המלצות שסופקו או מאושרים על ידי TradingView. קרא עוד בתנאים וההגבלות.