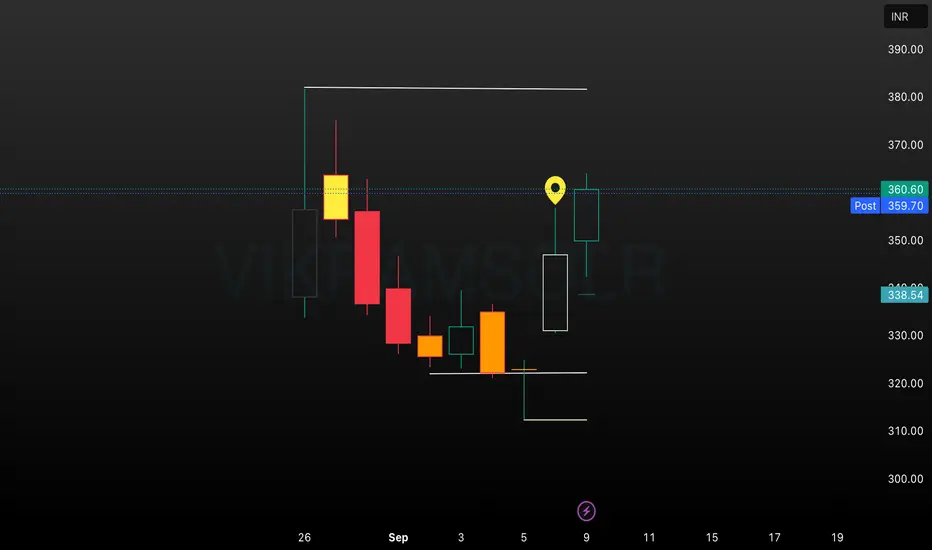
The VIKRAMSOLR daily chart illustrates a sustained recovery and momentum build-up after a series of bearish sessions. Price action rebounded from the recent low near ₹310–₹320, breaking past intermediate resistances with expanding volume and energized candlestick formation. The highlighted region signals renewed bullish participation and possible extension towards the next resistance
כתב ויתור
המידע והפרסומים אינם מיועדים להיות, ואינם מהווים, ייעוץ או המלצה פיננסית, השקעתית, מסחרית או מכל סוג אחר המסופקת או מאושרת על ידי TradingView. קרא עוד ב־תנאי השימוש.
כתב ויתור
המידע והפרסומים אינם מיועדים להיות, ואינם מהווים, ייעוץ או המלצה פיננסית, השקעתית, מסחרית או מכל סוג אחר המסופקת או מאושרת על ידי TradingView. קרא עוד ב־תנאי השימוש.