📊  VRT | Vertiv Holdings – AI vs Trader Mindset
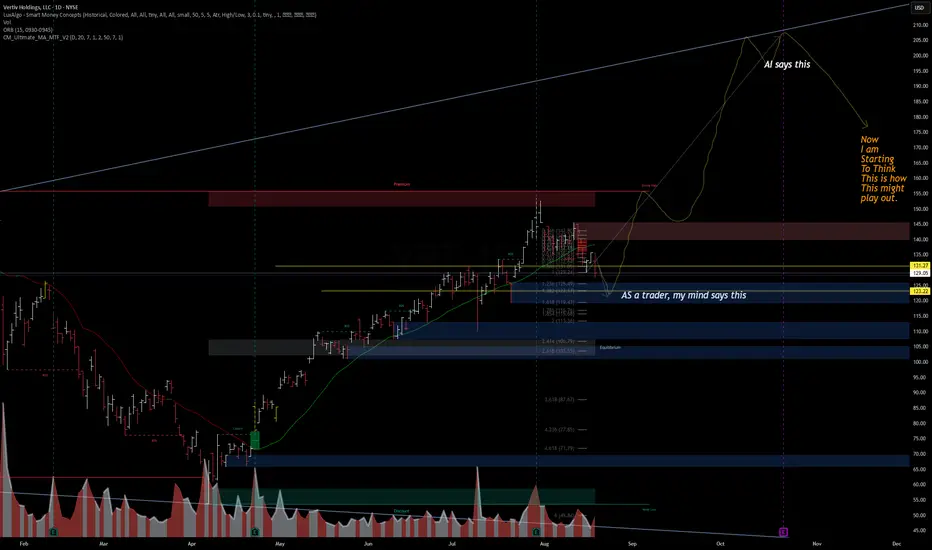
Interesting divergence here:
AI projection (yellow path) suggests a continuation higher toward $200+ before a macro pullback.
Trader’s view (blue zones) highlights liquidity gaps and possible retracement targets at $123, $116, and $106 before any bigger rally.
🔎 Chart Breakdown
Premium zone rejection near $140+
Equilibrium sits closer to $106
If downside liquidity sweep plays out, retracement into $116–123 demand zones could reload the uptrend.
⚖️ Key Levels
Bullish continuation: $145 → $175 → $200+
Bearish retracement: $123 → $116 → $106
💡 Sometimes AI favors trend continuation, while traders look for liquidity sweeps first. This setup could play out as a blend of both.
הערה
WaverVanir ⚡ To grow and conquer
stocktwits.com/WaverVanir | wavervanir.com | buymeacoffee.com/wavervanir
Not Investment Advice
stocktwits.com/WaverVanir | wavervanir.com | buymeacoffee.com/wavervanir
Not Investment Advice
כתב ויתור
המידע והפרסומים אינם אמורים להיות, ואינם מהווים, עצות פיננסיות, השקעות, מסחר או סוגים אחרים של עצות או המלצות שסופקו או מאושרים על ידי TradingView. קרא עוד בתנאים וההגבלות.