Overview:
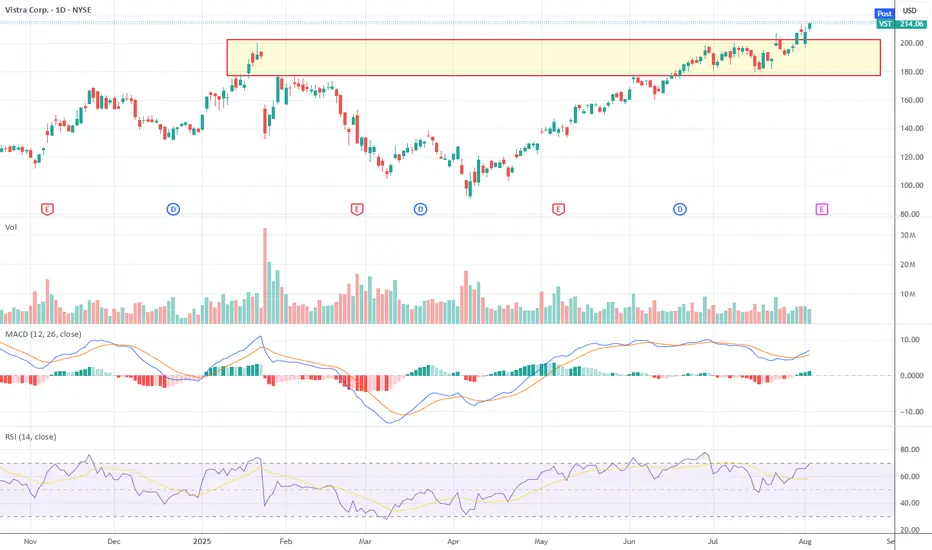
Vistra Corp. (NYSE:VST) has broken out of its recent range on the daily chart, supported by rising momentum and a clean bullish structure. The move is supported by volume and follows a textbook continuation pattern.
Price Action & Candlestick Structure
The last 3 daily candles show consistent strength, with the most recent forming a bullish marubozu , a strong signal that buyers are in control.
This follows an earlier indecision candle (spinning top/doji), which has now been invalidated by follow-through buying pressure.
No signs of exhaustion yet — no upper wicks, and no bearish reversal patterns like a shooting star or evening star.
Trend & Momentum
VST has been in a parabolic uptrend since mid-April 2025, with the slope of the trend accelerating recently.
MACD: Fresh bullish crossover, with the MACD line diverging from the signal line suggesting renewed upside momentum.
RSI: Currently at 68.67, elevated but not overbought, and no bearish divergence visible.
Volume: Steady with a modest uptick on the breakout candle, not euphoric, but constructive. No blow-off top behavior observed.
Box Breakout Setup
VST consolidated between $178–$202 from June through mid-July, forming a clean box range.
The stock broke above $202 with conviction, confirming the breakout on increasing volume.
Watching for continued follow-through in the sessions ahead. The breakout remains valid as long as price holds above $202.
Fibonacci Levels (from Jan 2025 low at ~$117 to recent high at ~$213)
Downside retracements:
23.6% = $192.46
38.2% = $180.54
50.0% = $165.00
61.8% = $149.46
78.6% = $128.94
Upside extensions:
100% = $213 (hit)
127.2% = $246.54
161.8% = $289.87
200% = $333.00
Trade Setup & Levels
Support: $202–$203 (prior resistance zone)
Resistance/Target: $246.54 (Fib 127.2%)
Stop-loss (invalidation): Below $198 (box bottom)
Strategy:
If long: continue to hold, consider pyramiding into strength toward $246. Use tight trailing stops below $203 or $202 depending on risk tolerance.
If not in: best entry is on a pullback to the breakout zone ($202–$203).
No short setup currently — price action shows strength, not weakness. Watch for signs of exhaustion before considering a fade.
Summary
The technicals on VST remain bullish. Breakout is clean, volume confirms, and momentum supports continuation. Unless the trend structure breaks down, this setup favors further upside in the short to medium term.
כתב ויתור
המידע והפרסומים אינם אמורים להיות, ואינם מהווים, עצות פיננסיות, השקעות, מסחר או סוגים אחרים של עצות או המלצות שסופקו או מאושרים על ידי TradingView. קרא עוד בתנאים וההגבלות.
כתב ויתור
המידע והפרסומים אינם אמורים להיות, ואינם מהווים, עצות פיננסיות, השקעות, מסחר או סוגים אחרים של עצות או המלצות שסופקו או מאושרים על ידי TradingView. קרא עוד בתנאים וההגבלות.