These are two daily timeframe charts of Wipro .
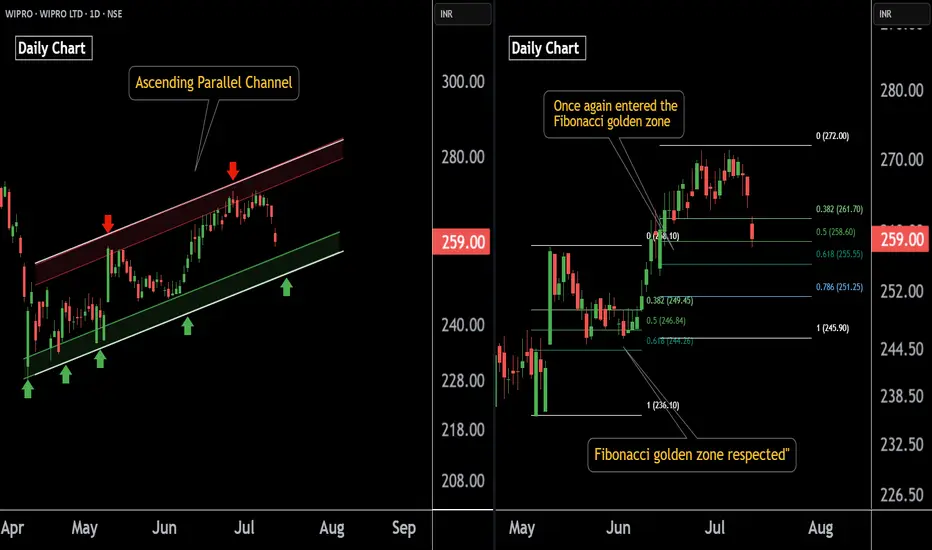
In the first chart : Wipro is trading within an ascending parallel channel, with the lower boundary positioned around the ₹251–₹254 zone.
Wipro has previously respected the Fibonacci golden zone, and the stock is once again approaching this key retracement area. A potential bounce from this zone is likely if the level is respected again around 254 near .
If this level is sustain , then we may see higher Prices in Wipro.
Thank You !!
@RahulSaraoge
Connect us at t.me/stridesadvisory
Connect us at t.me/stridesadvisory
כתב ויתור
המידע והפרסומים אינם מיועדים להיות, ואינם מהווים, ייעוץ או המלצה פיננסית, השקעתית, מסחרית או מכל סוג אחר המסופקת או מאושרת על ידי TradingView. קרא עוד ב־תנאי השימוש.
@RahulSaraoge
Connect us at t.me/stridesadvisory
Connect us at t.me/stridesadvisory
כתב ויתור
המידע והפרסומים אינם מיועדים להיות, ואינם מהווים, ייעוץ או המלצה פיננסית, השקעתית, מסחרית או מכל סוג אחר המסופקת או מאושרת על ידי TradingView. קרא עוד ב־תנאי השימוש.