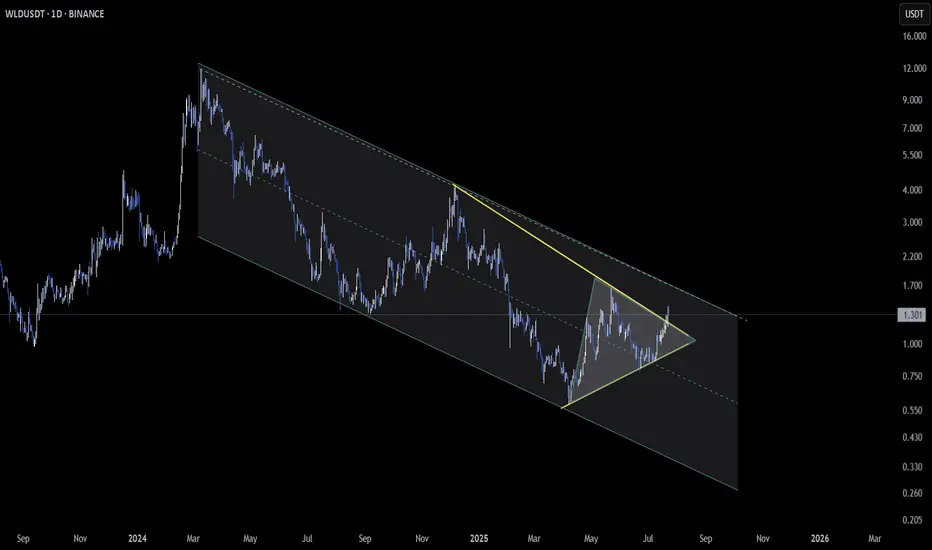
🔹 4H Chart: A clear breakout from a symmetrical triangle, signaling potential bullish momentum. If this breakout sustains with volume, short-term upside may follow.
🔸 Daily Chart: Price is still confined within a descending channel. This structure has been respected, and unless it’s broken, the broader trend remains capped.
👀 A potential scenario:
If the 4H breakout holds and the daily descending channel breaks, it could trigger a strong leg upward.
But if price gets rejected at the upper boundary of the daily channel, we may see a fade back into consolidation.
📌 Watch for volume confirmation and reaction near the daily resistance zone. A multi-timeframe breakout could bring explosive momentum.
Stay sharp and manage risk accordingly.
I share more in my court
Join me on X: x.com/Coin_Mastermind
Join me on Telegram: t.me/coin_mastermind
Join me on X: x.com/Coin_Mastermind
Join me on Telegram: t.me/coin_mastermind
כתב ויתור
המידע והפרסומים אינם אמורים להיות, ואינם מהווים, עצות פיננסיות, השקעות, מסחר או סוגים אחרים של עצות או המלצות שסופקו או מאושרים על ידי TradingView. קרא עוד בתנאים וההגבלות.