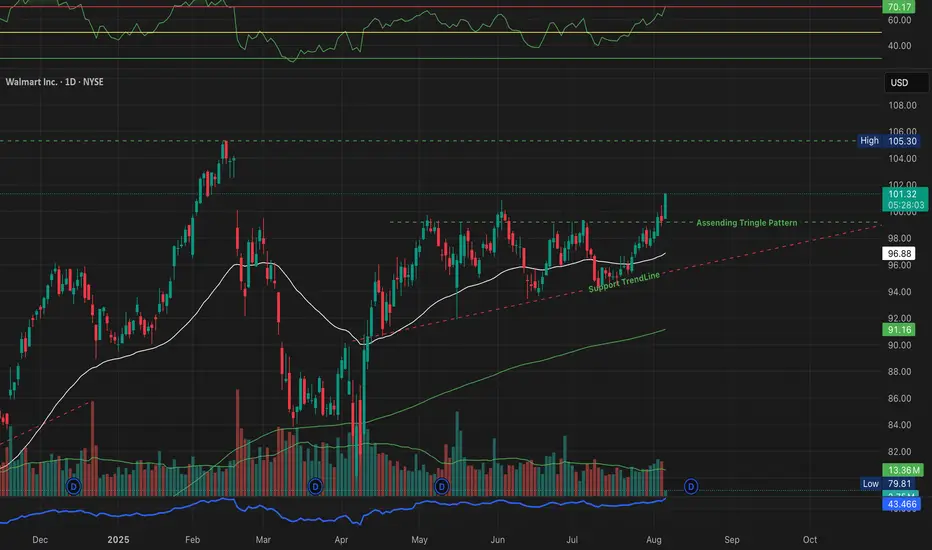
Walmart Inc. (Ticker: WMT), listed on the U.S. stock exchange (NYSE), appears to have formed a classic Ascending Triangle Pattern on the daily chart. As of August 6, 2025, the price has broken above the horizontal resistance near $100.60, closing at $101.16 with decent volume and strong bullish candles.
📈 Resistance zone: ~$100.60
📉 Support trendline: Rising since early May 2025
🔼 Breakout Level: ~$100.60 (now turned support)
📊 Volume: Breakout supported by above-average volume
💹 RSI: Currently near overbought zone (69.69), which indicates strength but also requires caution
If the price sustains above this level in the coming sessions, it could be a sign of continuation toward the next target zone of $105–106, as marked on the chart.
📊 Quick Fundamental Snapshot (2025):
Market Cap ~$400B
Revenue (TTM) ~$650B+
Net Income (TTM) ~$15B
EPS (TTM) ~$5.60
P/E Ratio ~18x
Dividend Yield ~1.5%
ROE ~18%
Walmart remains one of the strongest players in retail globally, with its recent focus on e-commerce, warehouse automation, and supply chain optimization boosting investor sentiment.
ANALYSIS BY MAYUR JAYANT TAKALIKAR -- FOR LEARNING & OBSERVATIONAL USE ONLY.
⚠️ Disclaimer
I am not a SEBI-registered advisor. This analysis is for educational and informational purposes only. Please do your own research or consult with a certified financial advisor before making any investment decisions.
כתב ויתור
המידע והפרסומים אינם אמורים להיות, ואינם מהווים, עצות פיננסיות, השקעות, מסחר או סוגים אחרים של עצות או המלצות שסופקו או מאושרים על ידי TradingView. קרא עוד בתנאים וההגבלות.
כתב ויתור
המידע והפרסומים אינם אמורים להיות, ואינם מהווים, עצות פיננסיות, השקעות, מסחר או סוגים אחרים של עצות או המלצות שסופקו או מאושרים על ידי TradingView. קרא עוד בתנאים וההגבלות.
