📈 WTI CRUDE OIL (USOIL) – SWING TRADE SETUP | VWMA BREAKOUT CONFIRMED 🛢️⚡
🎯 TRADE OVERVIEW
Asset: WTI Crude Oil (USOIL) – Energies Market
Trade Type: Swing Trade (Multi-Day Position)
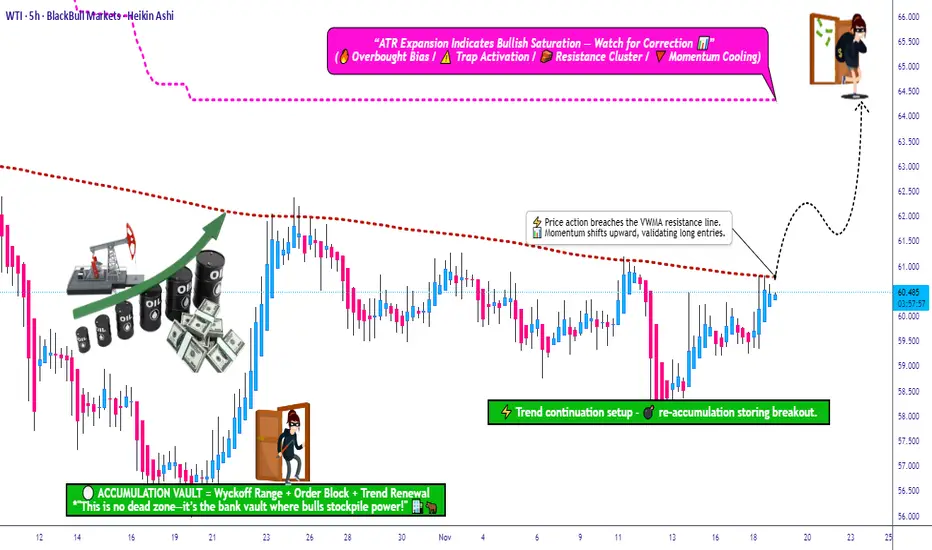
Bias: 🟢 BULLISH – Volume Weighted Moving Average (VWMA) breakout confirmed near $61.00
📊 TRADE PLAN
🔹 Entry Strategy: "Thief Layering Method"
Primary Entry Zone: Post-VWMA breakout above $61.00
Layered Limit Orders (Multiple Entry Points):
🟦 Layer 1: $59.00
🟦 Layer 2: $59.50
🟦 Layer 3: $60.00
🟦 Layer 4: $60.50
Note: You can add more layers based on your capital allocation and risk tolerance. This strategy allows averaging into the position as price pulls back.
🛑 Stop Loss Management
Thief's SL: $58.00
⚠️ IMPORTANT: Dear Ladies & Gentlemen (Thief OG's),
This is MY stop loss level. Adjust YOUR stop loss based on YOUR strategy and risk management plan. I do not recommend blindly following my SL – manage your own risk and capital accordingly.
🎯 Take Profit Target
Primary Target: $64.00
Technical Reasoning:
SuperTrend ATR line acts as strong dynamic resistance
Potential overbought zone + bull trap risk
Escape with profits before reversal pressure
⚠️ IMPORTANT: Dear Ladies & Gentlemen (Thief OG's),
This is MY take profit target. Take YOUR money at YOUR own risk. You are responsible for your profit-taking strategy – trail stops, scale out, or exit fully based on YOUR trading plan.
🔗 CORRELATED PAIRS TO WATCH (USD-Denominated)
Monitor these related assets for confirmation and risk assessment:
🛢️ Energy Sector:
Brent Crude Oil (UKOIL) – Typically trades $2-5 above WTI; if Brent is bullish, WTI usually follows
Natural Gas (NATGAS) – Energy sector sentiment indicator
💵 Currency Pairs:
USD/CAD – Inverse correlation to oil (CAD = petro-currency). If oil rises, USD/CAD typically falls
DXY (US Dollar Index) – Strong dollar = bearish pressure on oil. Watch for weakness in DXY to support oil rally
📈 Equity Markets:
Energy Sector ETFs (XLE) – Tracks US energy stocks; bullish XLE confirms oil sector strength
S&P 500 (SPX) – Risk-on sentiment supports commodity prices
⚡ Key Correlation Points:
Oil ↑ + USD/CAD ↓ = Strong bullish confirmation
Oil ↑ + DXY ↓ = Supportive macro environment
Oil ↑ + XLE ↑ = Energy sector momentum aligned
💬 Engagement Call-to-Action
👍 If you found this analysis helpful, smash that LIKE button!
💬 Drop your thoughts in the comments – are you bullish or bearish on oil?
🔔 FOLLOW for more professional trade setups and market insights!
🎯 TRADE OVERVIEW
Asset: WTI Crude Oil (USOIL) – Energies Market
Trade Type: Swing Trade (Multi-Day Position)
Bias: 🟢 BULLISH – Volume Weighted Moving Average (VWMA) breakout confirmed near $61.00
📊 TRADE PLAN
🔹 Entry Strategy: "Thief Layering Method"
Primary Entry Zone: Post-VWMA breakout above $61.00
Layered Limit Orders (Multiple Entry Points):
🟦 Layer 1: $59.00
🟦 Layer 2: $59.50
🟦 Layer 3: $60.00
🟦 Layer 4: $60.50
Note: You can add more layers based on your capital allocation and risk tolerance. This strategy allows averaging into the position as price pulls back.
🛑 Stop Loss Management
Thief's SL: $58.00
⚠️ IMPORTANT: Dear Ladies & Gentlemen (Thief OG's),
This is MY stop loss level. Adjust YOUR stop loss based on YOUR strategy and risk management plan. I do not recommend blindly following my SL – manage your own risk and capital accordingly.
🎯 Take Profit Target
Primary Target: $64.00
Technical Reasoning:
SuperTrend ATR line acts as strong dynamic resistance
Potential overbought zone + bull trap risk
Escape with profits before reversal pressure
⚠️ IMPORTANT: Dear Ladies & Gentlemen (Thief OG's),
This is MY take profit target. Take YOUR money at YOUR own risk. You are responsible for your profit-taking strategy – trail stops, scale out, or exit fully based on YOUR trading plan.
🔗 CORRELATED PAIRS TO WATCH (USD-Denominated)
Monitor these related assets for confirmation and risk assessment:
🛢️ Energy Sector:
Brent Crude Oil (UKOIL) – Typically trades $2-5 above WTI; if Brent is bullish, WTI usually follows
Natural Gas (NATGAS) – Energy sector sentiment indicator
💵 Currency Pairs:
USD/CAD – Inverse correlation to oil (CAD = petro-currency). If oil rises, USD/CAD typically falls
DXY (US Dollar Index) – Strong dollar = bearish pressure on oil. Watch for weakness in DXY to support oil rally
📈 Equity Markets:
Energy Sector ETFs (XLE) – Tracks US energy stocks; bullish XLE confirms oil sector strength
S&P 500 (SPX) – Risk-on sentiment supports commodity prices
⚡ Key Correlation Points:
Oil ↑ + USD/CAD ↓ = Strong bullish confirmation
Oil ↑ + DXY ↓ = Supportive macro environment
Oil ↑ + XLE ↑ = Energy sector momentum aligned
💬 Engagement Call-to-Action
👍 If you found this analysis helpful, smash that LIKE button!
💬 Drop your thoughts in the comments – are you bullish or bearish on oil?
🔔 FOLLOW for more professional trade setups and market insights!
💰 Money-Making Analysis
• Forex💹
• Indices📈
• Crypto ₿
• Commodities⚡
• Stocks🏦
• Fundamental + Macro📊
• Sentiment🔎
👉 Ask what analysis you need & get it FREE!
Join Discord for signals + data & grab the Master Plan: discord.gg/ZQS3y7FhVr
• Forex💹
• Indices📈
• Crypto ₿
• Commodities⚡
• Stocks🏦
• Fundamental + Macro📊
• Sentiment🔎
👉 Ask what analysis you need & get it FREE!
Join Discord for signals + data & grab the Master Plan: discord.gg/ZQS3y7FhVr
פרסומים קשורים
כתב ויתור
המידע והפרסומים אינם מיועדים להיות, ואינם מהווים, ייעוץ או המלצה פיננסית, השקעתית, מסחרית או מכל סוג אחר המסופקת או מאושרת על ידי TradingView. קרא עוד ב־תנאי השימוש.