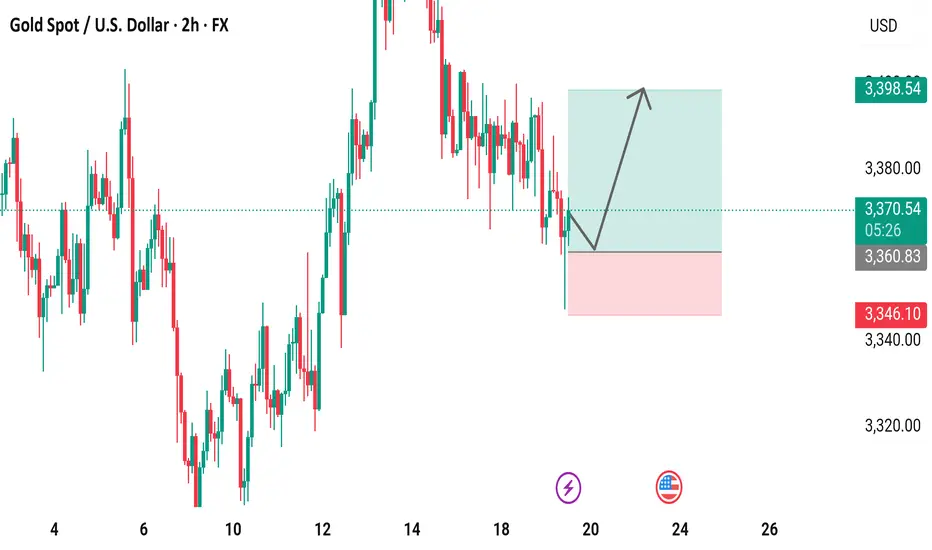
2-hour candlestick chart of the Gold Spot/U.S. Dollar (XAU/USD) currency pair, displayed on TradingView, a popular trading platform. The chart tracks price movements over a period from the 4th to the 26th, with each candlestick representing a 2-hour interval. The price levels, shown on the y-axis, range from 3,320.00 to 3,398.54 USD, while the x-axis marks the corresponding dates. The current price is 3,370.55 USD, up by 1.61 points (+0.05%), highlighted in green to indicate a positive change. Green candlesticks represent bullish (upward) price movements, while red ones indicate bearish (downward) trends, offering a clear view of market dynamics.
כתב ויתור
המידע והפרסומים אינם אמורים להיות, ואינם מהווים, עצות פיננסיות, השקעות, מסחר או סוגים אחרים של עצות או המלצות שסופקו או מאושרים על ידי TradingView. קרא עוד בתנאים וההגבלות.
כתב ויתור
המידע והפרסומים אינם אמורים להיות, ואינם מהווים, עצות פיננסיות, השקעות, מסחר או סוגים אחרים של עצות או המלצות שסופקו או מאושרים על ידי TradingView. קרא עוד בתנאים וההגבלות.