October 15th Gold and Forex Analysis
Viewpoint: The current international spot gold price is around 4190. Today's high of 4218 represents a $76 increase from the previous trading day. While the increase is not significant compared to the past few days, this surge was driven by Powell's remarks and the continued US government shutdown. The current market rally may be accelerating, or it could be the final frenzy (due to sudden negative news). I would like to remind everyone to set a stop-loss order to protect your principal.
Technical Analysis
Daily Chart Level: Following an Upward Cycle
1. Trend and Rhythm: The daily chart closed with a full, large bullish candlestick, confirming a strong bullish pattern. The market is currently following a typical upward cycle: consecutive rising highs -> consolidation at high levels -> a single bearish pullback -> continued upward momentum.
2. Key Positions:
Resistance: The current price has broken through the previous high, and there is currently no clear resistance above. Focus on inertial upward momentum. Support: 4100 (the 5-day moving average moving up tomorrow) has become the core lifeline of the current bullish trend. The second highest support level is 4050 (the 10-day moving average).
3. Future Forecast:
Today (Wednesday) is likely to see another positive close, continuing the strong trend.
Tomorrow (Thursday), be highly alert to the possibility of a single-day bearish pullback, targeting a test of the 5-day moving average support level near 4100 yuan/gram.
If a pullback occurs, it should be viewed as a "squat and jump" opportunity, a rare opportunity to enter the market at a low point within the trend.
4-Hour Level: Keep a close eye on the moving average support.
1. Current Trend: This cycle exhibits a "consecutive bullish and single-day bearish" pattern of forced gains, with the moving average system showing a perfect bullish alignment.
2. Dynamic Support:
Strong Support: 4180 (the current 5-period moving average). As long as the price remains above this line, the market remains extremely strong.
Key Support: 4156 (the current 10-period moving average). This is a short-term watershed between bulls and bears. Only a significant break below this level would signal the end of this short squeeze rally, ushering in a deep correction toward the middle band.
Note: The above support levels will shift upward rapidly over time and require dynamic tracking.
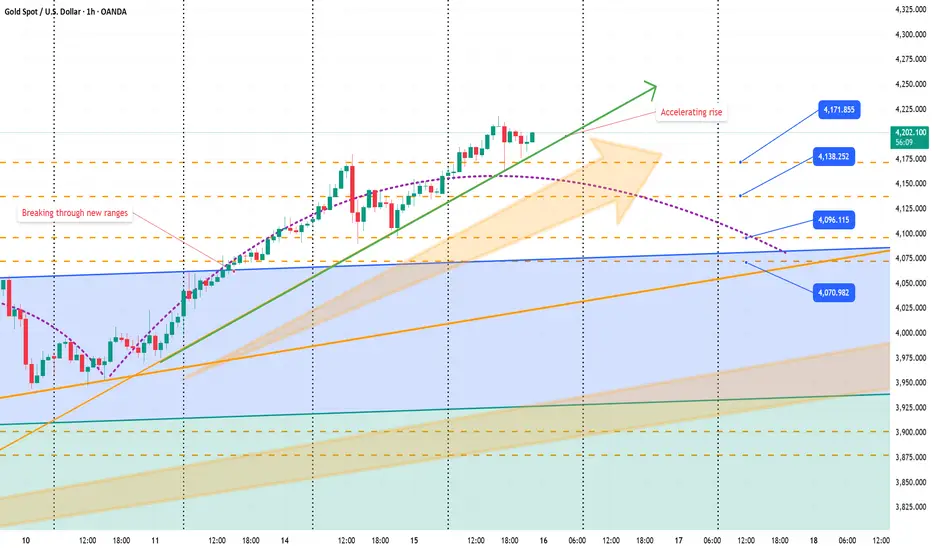
Hourly Level: High-Level Oscillation
1. Intraday Trend Review: The strong rally in the Asian session exceeded expectations. After accurately touching 4218 (the upper band of the hourly chart channel) in the European session, the price plummeted to 4165 before rebounding, confirming the effectiveness of the channel resistance.
2. Night Trading Range:
Upper Resistance: 4220 - 4225 (derivative of the upper band of the channel). If this area is touched, monitor for signs of resistance and attempt a short-term short position.
Lower Support: 4170 (the middle band of the hourly chart and the previous channel retracement point). If it falls back to this area, monitor for signs of stabilization, using it as an entry point for intraday long positions.
Strategy: The market is likely to fluctuate strongly at high levels. We recommend looking for opportunities to buy low and sell high near resistance and support levels, focusing on short-term trading.
Trade with caution and manage risk. Best of luck!
Viewpoint: The current international spot gold price is around 4190. Today's high of 4218 represents a $76 increase from the previous trading day. While the increase is not significant compared to the past few days, this surge was driven by Powell's remarks and the continued US government shutdown. The current market rally may be accelerating, or it could be the final frenzy (due to sudden negative news). I would like to remind everyone to set a stop-loss order to protect your principal.
Technical Analysis
Daily Chart Level: Following an Upward Cycle
1. Trend and Rhythm: The daily chart closed with a full, large bullish candlestick, confirming a strong bullish pattern. The market is currently following a typical upward cycle: consecutive rising highs -> consolidation at high levels -> a single bearish pullback -> continued upward momentum.
2. Key Positions:
Resistance: The current price has broken through the previous high, and there is currently no clear resistance above. Focus on inertial upward momentum. Support: 4100 (the 5-day moving average moving up tomorrow) has become the core lifeline of the current bullish trend. The second highest support level is 4050 (the 10-day moving average).
3. Future Forecast:
Today (Wednesday) is likely to see another positive close, continuing the strong trend.
Tomorrow (Thursday), be highly alert to the possibility of a single-day bearish pullback, targeting a test of the 5-day moving average support level near 4100 yuan/gram.
If a pullback occurs, it should be viewed as a "squat and jump" opportunity, a rare opportunity to enter the market at a low point within the trend.
4-Hour Level: Keep a close eye on the moving average support.
1. Current Trend: This cycle exhibits a "consecutive bullish and single-day bearish" pattern of forced gains, with the moving average system showing a perfect bullish alignment.
2. Dynamic Support:
Strong Support: 4180 (the current 5-period moving average). As long as the price remains above this line, the market remains extremely strong.
Key Support: 4156 (the current 10-period moving average). This is a short-term watershed between bulls and bears. Only a significant break below this level would signal the end of this short squeeze rally, ushering in a deep correction toward the middle band.
Note: The above support levels will shift upward rapidly over time and require dynamic tracking.
Hourly Level: High-Level Oscillation
1. Intraday Trend Review: The strong rally in the Asian session exceeded expectations. After accurately touching 4218 (the upper band of the hourly chart channel) in the European session, the price plummeted to 4165 before rebounding, confirming the effectiveness of the channel resistance.
2. Night Trading Range:
Upper Resistance: 4220 - 4225 (derivative of the upper band of the channel). If this area is touched, monitor for signs of resistance and attempt a short-term short position.
Lower Support: 4170 (the middle band of the hourly chart and the previous channel retracement point). If it falls back to this area, monitor for signs of stabilization, using it as an entry point for intraday long positions.
Strategy: The market is likely to fluctuate strongly at high levels. We recommend looking for opportunities to buy low and sell high near resistance and support levels, focusing on short-term trading.
Trade with caution and manage risk. Best of luck!
Public Channel:t.me/+CW0VWaiEB59hMmJh
כתב ויתור
המידע והפרסומים אינם אמורים להיות, ואינם מהווים, עצות פיננסיות, השקעות, מסחר או סוגים אחרים של עצות או המלצות שסופקו או מאושרים על ידי TradingView. קרא עוד בתנאים וההגבלות.
Public Channel:t.me/+CW0VWaiEB59hMmJh
כתב ויתור
המידע והפרסומים אינם אמורים להיות, ואינם מהווים, עצות פיננסיות, השקעות, מסחר או סוגים אחרים של עצות או המלצות שסופקו או מאושרים על ידי TradingView. קרא עוד בתנאים וההגבלות.