Brief technical analysis
1. General structure and main dynamics
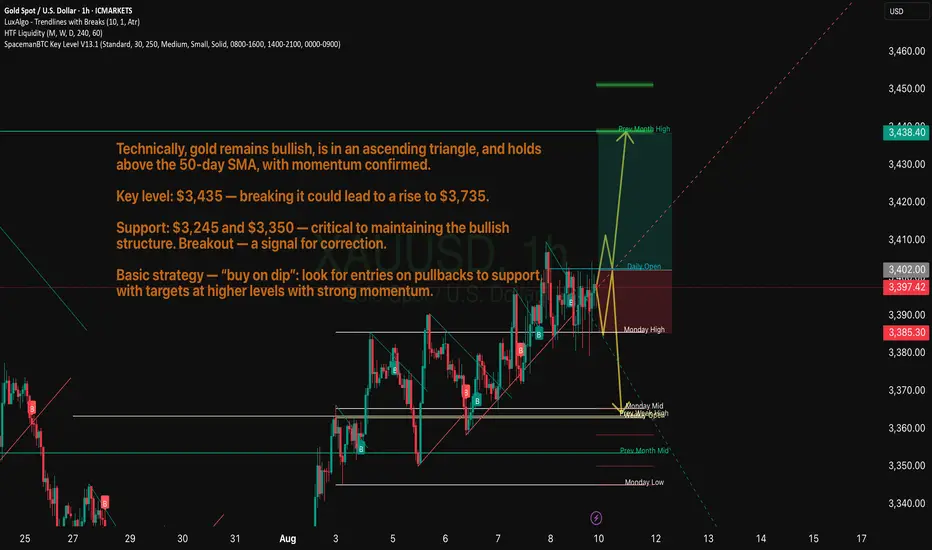
Gold is trading in an ascending triangle, a bullish pattern indicating potential for further gains. The price has consolidated above the 50-day moving average, and the RSI is reinforcing the bullish sentiment.
The MACD and RSI (≈ 54.7) are signaling growing positive momentum, especially after the rebound from the lower Bollinger band and the formation of EMA-8/EMA-21 crosses.
Citi has raised its forecast to $3,300-3,600 over the next three months, given the weak US economy and the weakening dollar.
Yesterday, gold prices were close to a multi-year high near $3,400. A break of resistance around $3,435 could bring gains to the target of $3,735 (according to the “measured move” pattern).
However, an HSBC analyst warns of weakness in momentum; a pullback after growth is possible, especially with an improving global background and a delayed tightening by the Fed.
2. Key levels
Resistance:
~$3,435 — the top of the ascending triangle
If broken — potential target $3,735
Investopedia
Support:
~$3,245 — the lower boundary of the structure and the zone of a possible pullback
Next — ~$3,150 with further sales
50-day SMA: ~$3,350 — a critical level for maintaining the bullish scenario
1. General structure and main dynamics
Gold is trading in an ascending triangle, a bullish pattern indicating potential for further gains. The price has consolidated above the 50-day moving average, and the RSI is reinforcing the bullish sentiment.
The MACD and RSI (≈ 54.7) are signaling growing positive momentum, especially after the rebound from the lower Bollinger band and the formation of EMA-8/EMA-21 crosses.
Citi has raised its forecast to $3,300-3,600 over the next three months, given the weak US economy and the weakening dollar.
Yesterday, gold prices were close to a multi-year high near $3,400. A break of resistance around $3,435 could bring gains to the target of $3,735 (according to the “measured move” pattern).
However, an HSBC analyst warns of weakness in momentum; a pullback after growth is possible, especially with an improving global background and a delayed tightening by the Fed.
2. Key levels
Resistance:
~$3,435 — the top of the ascending triangle
If broken — potential target $3,735
Investopedia
Support:
~$3,245 — the lower boundary of the structure and the zone of a possible pullback
Next — ~$3,150 with further sales
50-day SMA: ~$3,350 — a critical level for maintaining the bullish scenario
פרסומים קשורים
כתב ויתור
המידע והפרסומים אינם אמורים להיות, ואינם מהווים, עצות פיננסיות, השקעות, מסחר או סוגים אחרים של עצות או המלצות שסופקו או מאושרים על ידי TradingView. קרא עוד בתנאים וההגבלות.
פרסומים קשורים
כתב ויתור
המידע והפרסומים אינם אמורים להיות, ואינם מהווים, עצות פיננסיות, השקעות, מסחר או סוגים אחרים של עצות או המלצות שסופקו או מאושרים על ידי TradingView. קרא עוד בתנאים וההגבלות.