Gold hourly chart;
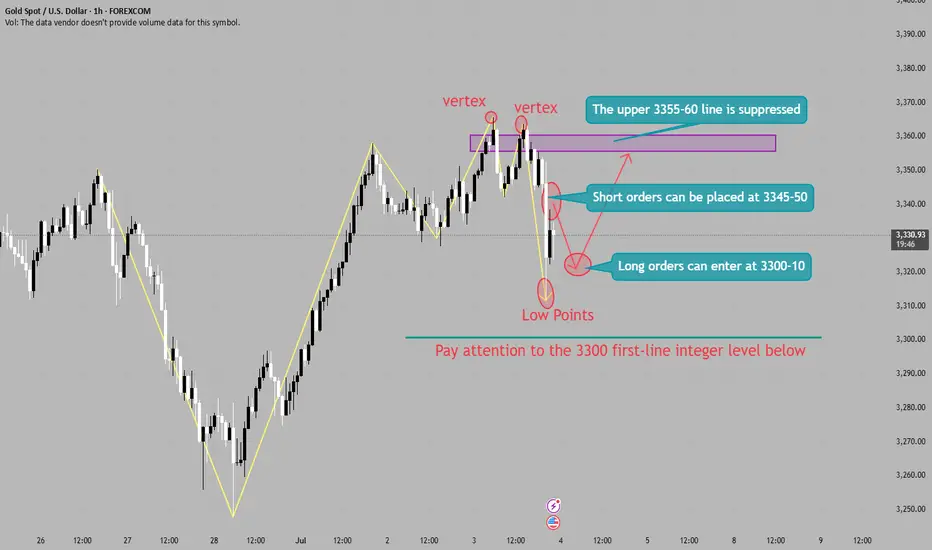
Gold short-term analysis; Gold 4-hour analysis shows that the stochastic indicator is golden cross, which is a bullish signal; MACD indicator double lines stick together upward, which is a bullish signal; 4-hour bias continues to rise; 4-hour downward trend channel is temporarily suppressed, and the pressure position is around 3355-60.
Gold short-term analysis; Gold 4-hour analysis shows that the stochastic indicator is golden cross, which is a bullish signal; MACD indicator double lines stick together upward, which is a bullish signal; 4-hour bias continues to rise; 4-hour downward trend channel is temporarily suppressed, and the pressure position is around 3355-60.
עסקה פעילה
We only provide general trend direction and operation ideas, and publish market trend analysis and operation strategy analysis every day. If you need to verify our analysis strength, you can click the link to see it yourself. When you fully recognize our trading logic, consider whether to participate in real-time operations; if you need to obtain more detailed operation strategies and stop-profit and stop-loss plans, you can consult through the homepage link. If you have any doubts, it is recommended to continue to observe to avoid invalid time costs - after all, investment needs to focus on value, not formal communication. 👇👇👇t.me/+lQIvgUv8CKZiMDI0
כתב ויתור
המידע והפרסומים אינם מיועדים להיות, ואינם מהווים, ייעוץ או המלצה פיננסית, השקעתית, מסחרית או מכל סוג אחר המסופקת או מאושרת על ידי TradingView. קרא עוד ב־תנאי השימוש.
כתב ויתור
המידע והפרסומים אינם מיועדים להיות, ואינם מהווים, ייעוץ או המלצה פיננסית, השקעתית, מסחרית או מכל סוג אחר המסופקת או מאושרת על ידי TradingView. קרא עוד ב־תנאי השימוש.