Counting 2:
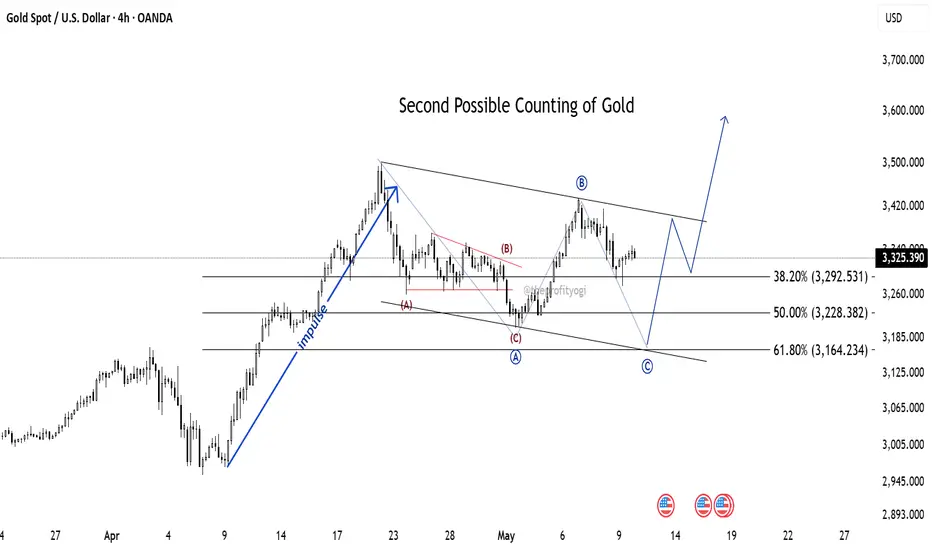
Here, after an impulse, a Zig-zag correction is formed (marked in red ABC)
Here, I have assumed that this is just point (A) of further correction (in blue colour).
Then the price has gone to form wave (B), and currently the market is in wave (C).
This correction will complete near 61.8% (near 3164 level). And from here, a new impulse will start.
This analysis is based on Elliott Wave theory and Fibonacci study.
This analysis is for educational purposes only.
כתב ויתור
המידע והפרסומים אינם אמורים להיות, ואינם מהווים, עצות פיננסיות, השקעות, מסחר או סוגים אחרים של עצות או המלצות שסופקו או מאושרים על ידי TradingView. קרא עוד בתנאים וההגבלות.
כתב ויתור
המידע והפרסומים אינם אמורים להיות, ואינם מהווים, עצות פיננסיות, השקעות, מסחר או סוגים אחרים של עצות או המלצות שסופקו או מאושרים על ידי TradingView. קרא עוד בתנאים וההגבלות.