🧭 General Overview
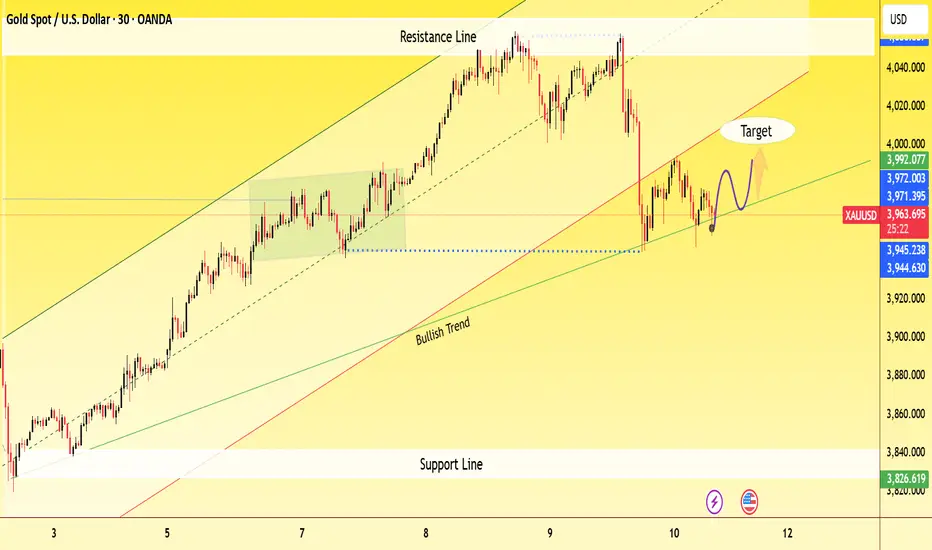
Instrument: Gold Spot / USD (XAU/USD)
Timeframe: 30-minute
Current Price: 3,958.59
Trend: Overall bullish, but showing short-term correction
📊 Key Technical Elements on Chart
1. Bullish Trendline
The green upward trendline labeled “Bullish Trend” indicates that gold remains in a long-term uptrend.
Price is currently testing this bullish trendline — a crucial support area.
2. Resistance Zone
The resistance line near 3,992–4,000 marks the recent swing high where price was rejected.
Each approach to this zone triggered a pullback, indicating strong selling pressure ther
עסקה פעילה
Gis holding above 4000 support area continuation upward channel. The market structure shows uptrend momentum and phase the targets beyond 4007 0n strength.t.me/PRICEACTIONFOREX007
IAM FOREX PROFESSIONAL TRADER IAM PROVIDING BEST AND HUGE PROFITABLE FORECASTS
t.me/PRICEACTIONFOREX007
IAM FOREX PROFESSIONAL TRADER IAM PROVIDING BEST AND HUGE PROFITABLE FORECASTS
t.me/PRICEACTIONFOREX007
כתב ויתור
המידע והפרסומים אינם אמורים להיות, ואינם מהווים, עצות פיננסיות, השקעות, מסחר או סוגים אחרים של עצות או המלצות שסופקו או מאושרים על ידי TradingView. קרא עוד בתנאים וההגבלות.
t.me/PRICEACTIONFOREX007
IAM FOREX PROFESSIONAL TRADER IAM PROVIDING BEST AND HUGE PROFITABLE FORECASTS
t.me/PRICEACTIONFOREX007
IAM FOREX PROFESSIONAL TRADER IAM PROVIDING BEST AND HUGE PROFITABLE FORECASTS
t.me/PRICEACTIONFOREX007
כתב ויתור
המידע והפרסומים אינם אמורים להיות, ואינם מהווים, עצות פיננסיות, השקעות, מסחר או סוגים אחרים של עצות או המלצות שסופקו או מאושרים על ידי TradingView. קרא עוד בתנאים וההגבלות.