A H&S Pattern has formed in the XLK. What does it mean?
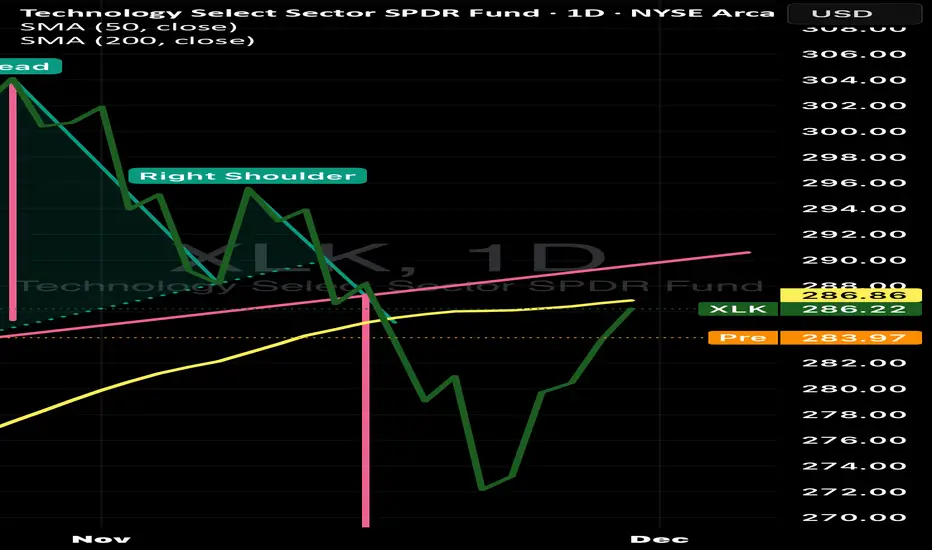
A head-and-shoulders pattern usually signals a potential trend reversal from bullish to bearish.
What to watch (triggers & confirmation)
1. Neckline break on volume — primary sell signal. Wait for a daily close below $283–285 with higher volume for confirmation.
2. Retest behavior — if price breaks and then returns to the neckline and is rejected (fails to reclaim it), that’s a strong continuation signal.
3. Momentum indicators — look for RSI falling below 50 and MACD turning bearish to add confidence.
4. 200-SMA reaction — a bounce there could be a good place to trim or hedge; a break below it strengthens the move toward the $265 measured target.
5. Market breadth / sentiment — if broad market or sector rotation accelerates away from tech, the pattern’s odds rise; if the market rallies, pattern may fail.
Do you agree? Any in contrary’s comments?
כתב ויתור
המידע והפרסומים אינם מיועדים להיות, ואינם מהווים, ייעוץ או המלצה פיננסית, השקעתית, מסחרית או מכל סוג אחר המסופקת או מאושרת על ידי TradingView. קרא עוד ב־תנאי השימוש.
כתב ויתור
המידע והפרסומים אינם מיועדים להיות, ואינם מהווים, ייעוץ או המלצה פיננסית, השקעתית, מסחרית או מכל סוג אחר המסופקת או מאושרת על ידי TradingView. קרא עוד ב־תנאי השימוש.