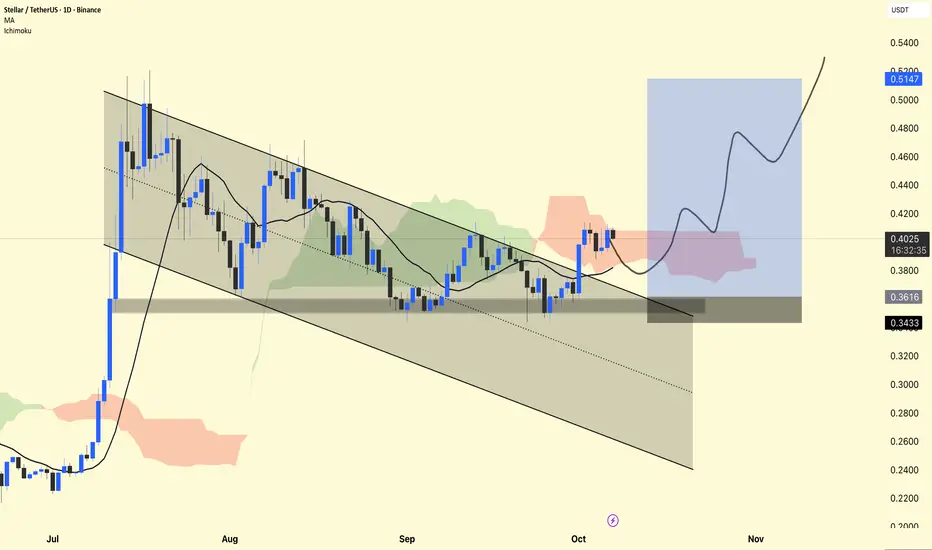
XLM/USDT — Daily Chart Analysis
The price is currently trading around $0.40, holding firmly above the demand zone ($0.36–$0.34).
The chart shows a falling channel breakout, which is a bullish reversal pattern.
The Ichimoku Cloud is showing early signs of a bullish trend as the price is attempting to hold above the cloud base.
The moving average (MA) at $0.38 is acting as dynamic support – a positive sign for further upside.
📈 Long Setup:
Entry Zone: $0.38–$0.40
Stop-Loss: Below $0.34 (clear invalidation level)
Targets:
🎯 $0.46 → First Target
🎯 $0.51 → Main Swing Target
DYOR | NFA
פרסומים קשורים
כתב ויתור
המידע והפרסומים אינם מיועדים להיות, ואינם מהווים, ייעוץ או המלצה פיננסית, השקעתית, מסחרית או מכל סוג אחר המסופקת או מאושרת על ידי TradingView. קרא עוד ב־תנאי השימוש.
פרסומים קשורים
כתב ויתור
המידע והפרסומים אינם מיועדים להיות, ואינם מהווים, ייעוץ או המלצה פיננסית, השקעתית, מסחרית או מכל סוג אחר המסופקת או מאושרת על ידי TradingView. קרא עוד ב־תנאי השימוש.