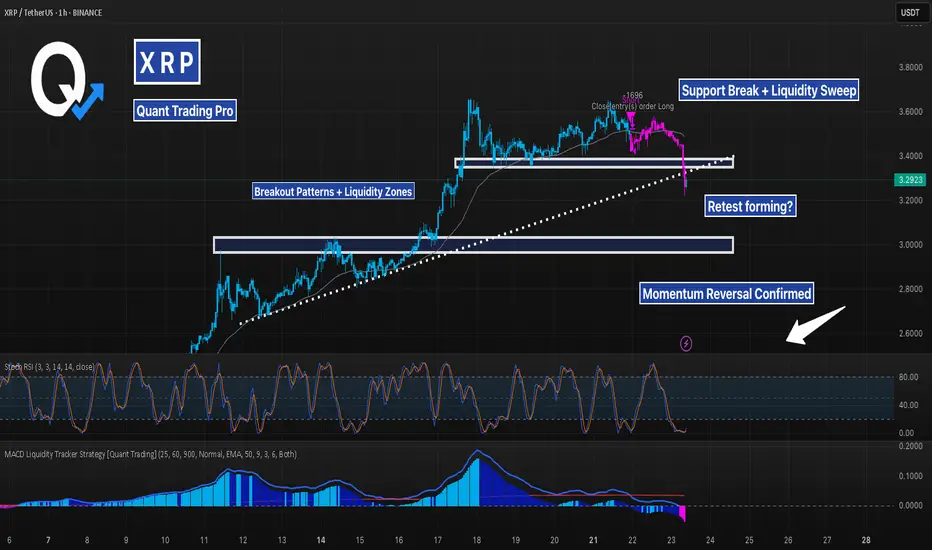
XRP just gave us a clean breakdown below a well-formed ascending structure, violating both its dynamic trendline and horizontal support.
Let’s break down the setup:
🔹 Trend Context: Price was holding cleanly above the MA and respecting a dotted trendline, bouncing off prior breakout zones multiple times. This uptrend was sustained for days, with momentum supported by both MACD histogram expansion and Stoch RSI resets.
🔹 Structure Shift: After a minor consolidation, price rejected from the upper range and aggressively broke below support. The last long was closed during this transition — confirming the momentum was fading.
🔹 Liquidity Zones: The prior resistance-turned-support zone failed, with price wicking below and potentially sweeping stop orders before stabilizing.
🔹 Momentum Flip: MACD histogram has flipped red, and Stoch RSI is deeply oversold. This signals possible short-term exhaustion, but trend structure is clearly damaged.
Traders now face two scenarios:
1️⃣ Bearish case → Breakdown holds, and price trends lower into deeper liquidity (~3.00 or even 2.71).
2️⃣ Bullish case → Price reclaims structure with strength, invalidating the breakdown and trapping early shorts.
Key levels are in play. Wait for confirmation — especially on the retest.
#XRP #Breakdown #CryptoAnalysis #MACDStrategy #SupportResistance #LiquidityZones #TrendBreak #TechnicalAnalysis #AlgoTrading #QuantStrategy
Explore 5,000 Strategies at quanttradingpro.com
Search for the most profitable, lowest risk by symbol!
Search by indicators like Supertrend, Ichimoku, macd.
Join our discord discord.gg/2systG9frc
We provide education & tools.
Search for the most profitable, lowest risk by symbol!
Search by indicators like Supertrend, Ichimoku, macd.
Join our discord discord.gg/2systG9frc
We provide education & tools.
כתב ויתור
המידע והפרסומים אינם אמורים להיות, ואינם מהווים, עצות פיננסיות, השקעות, מסחר או סוגים אחרים של עצות או המלצות שסופקו או מאושרים על ידי TradingView. קרא עוד בתנאים וההגבלות.