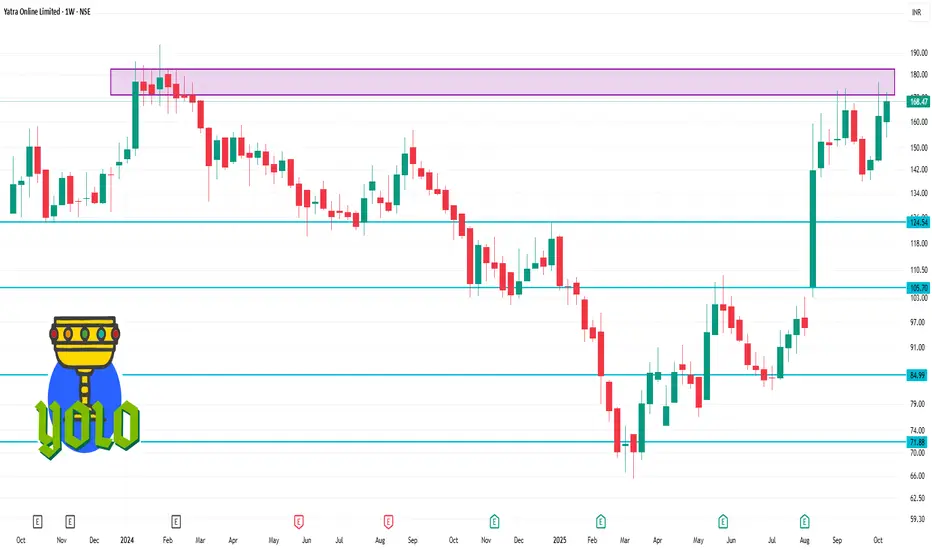
📈 1-Week Price Performance (Oct 10–Oct 17, 2025)
Opening Price (Oct 10): ₹162.23
Closing Price (Oct 17): ₹168.47
Weekly Gain: +3.85%
This upward trend indicates a steady recovery and positive sentiment among investors.
🔍 Key Highlights
52-Week Range: ₹65.51 – ₹176.66
Market Capitalization: ₹2,643.57 crore
P/E Ratio: 53.15
P/B Ratio: 3.29
Earnings Per Share (EPS): ₹3.09 (as of June 2025)
These metrics suggest that while the stock is trading at a premium, it reflects the market's expectations of future growth.
📊 Technical Indicators
50-Day Simple Moving Average (SMA): ₹148.20
200-Day SMA: ₹104.50
Relative Strength Index (RSI): 64.5 (indicating moderate bullish momentum)
Money Flow Index (MFI): 76.1 (approaching overbought territory)
These indicators suggest that the stock is in a strong uptrend, though investors should monitor for potential overbought conditions.
פרסומים קשורים
כתב ויתור
המידע והפרסומים אינם מיועדים להיות, ואינם מהווים, ייעוץ או המלצה פיננסית, השקעתית, מסחרית או מכל סוג אחר המסופקת או מאושרת על ידי TradingView. קרא עוד ב־תנאי השימוש.
פרסומים קשורים
כתב ויתור
המידע והפרסומים אינם מיועדים להיות, ואינם מהווים, ייעוץ או המלצה פיננסית, השקעתית, מסחרית או מכל סוג אחר המסופקת או מאושרת על ידי TradingView. קרא עוד ב־תנאי השימוש.