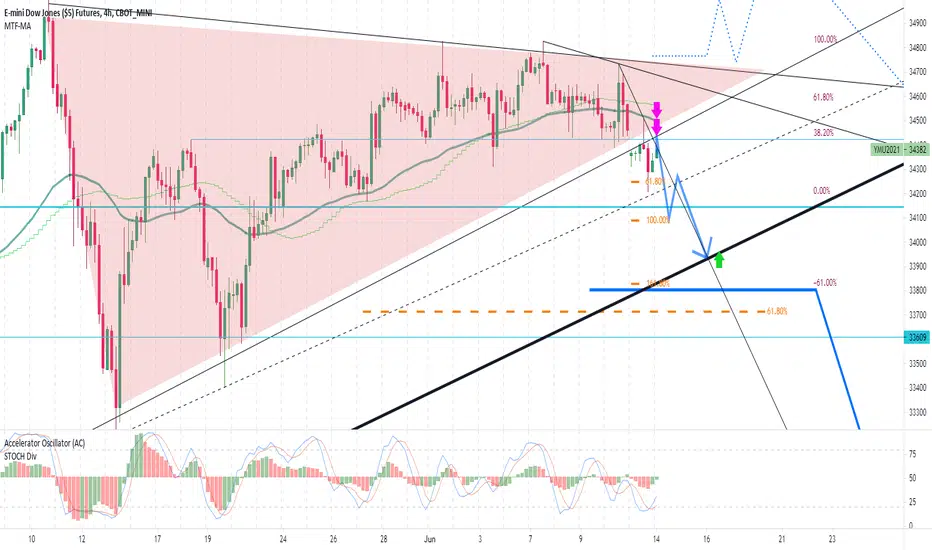
daily chart clearly show sell , we have 2 trend line in down , technical say if dowjones can break them ,down trend will start ,can go to 28500 (big gap on cash phisical dowjones)
tradingview.com/chart/jtsoM2GC/
red arrow=powerfull sellimit place with sl and trailstop= 80
green arrow=buylimit place with sl and trailstop=80
if big trend (daily chart trend line start from corona crash) near 33900 break , you can sell
tradingview.com/chart/jtsoM2GC/
red arrow=powerfull sellimit place with sl and trailstop= 80
green arrow=buylimit place with sl and trailstop=80
if big trend (daily chart trend line start from corona crash) near 33900 break , you can sell
כתב ויתור
המידע והפרסומים אינם מיועדים להיות, ואינם מהווים, ייעוץ או המלצה פיננסית, השקעתית, מסחרית או מכל סוג אחר המסופקת או מאושרת על ידי TradingView. קרא עוד ב־תנאי השימוש.
כתב ויתור
המידע והפרסומים אינם מיועדים להיות, ואינם מהווים, ייעוץ או המלצה פיננסית, השקעתית, מסחרית או מכל סוג אחר המסופקת או מאושרת על ידי TradingView. קרא עוד ב־תנאי השימוש.