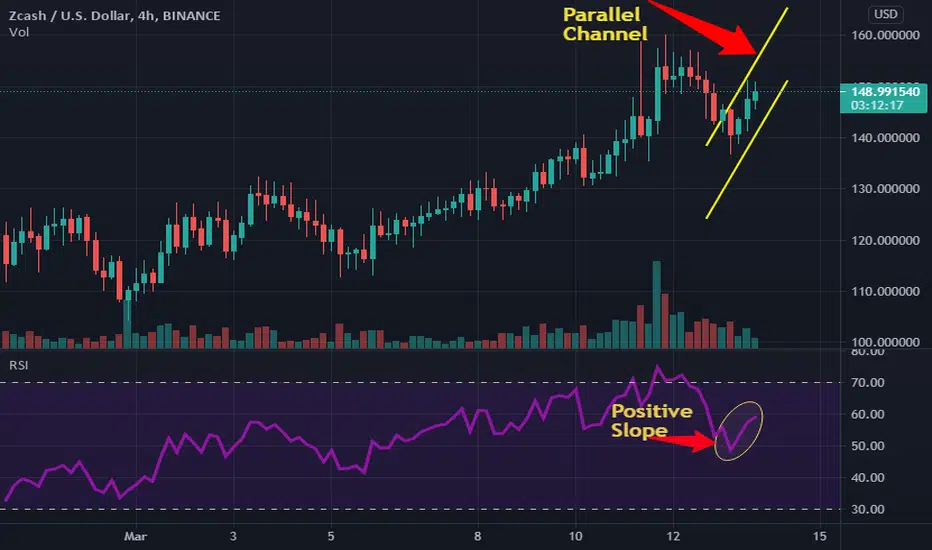
.The daily chart of ZEC hints at the start of a bullish move. On coming to the shorter time frame of 4 hours, the coin has formed a upward parallel channel. If the price breaks above 5% of the current position, it can see a rally upto $200 in upcoming trading sessions.ZEC price can also see a new low if it comes below the channel.
Kindly comment your thoughts below
Kindly comment your thoughts below
פרסומים קשורים
כתב ויתור
המידע והפרסומים אינם אמורים להיות, ואינם מהווים, עצות פיננסיות, השקעות, מסחר או סוגים אחרים של עצות או המלצות שסופקו או מאושרים על ידי TradingView. קרא עוד בתנאים וההגבלות.
פרסומים קשורים
כתב ויתור
המידע והפרסומים אינם אמורים להיות, ואינם מהווים, עצות פיננסיות, השקעות, מסחר או סוגים אחרים של עצות או המלצות שסופקו או מאושרים על ידי TradingView. קרא עוד בתנאים וההגבלות.