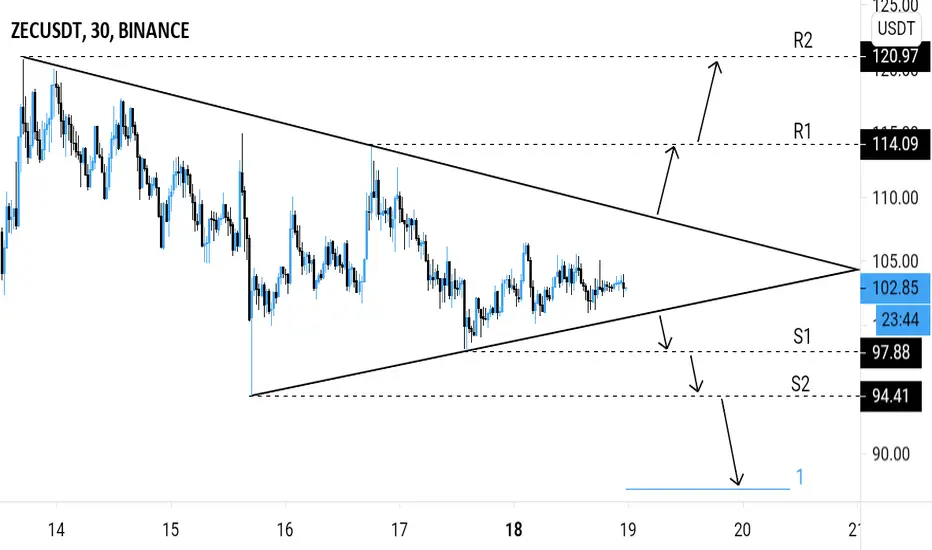
Analysis 🔎: ZENUSDT is consolidating in a symmetrical triangle pattern.
Breakout is imminent.
Bullish ⬆️: breakout above the symmetrical triangle's inclined resistance.
Bearish ⬇️: breakdown below the symmetrical triangle's inclined support.
Possible breakout price actions are indicated by the arrows on the chart.
Targets 🎯: Bullish ⬆️ - horizontal resistance levels (R1, R2).
Bearish ⬇️ - horizontal support levels (S1, S2), fibonacci extension levels.
כתב ויתור
המידע והפרסומים אינם אמורים להיות, ואינם מהווים, עצות פיננסיות, השקעות, מסחר או סוגים אחרים של עצות או המלצות שסופקו או מאושרים על ידי TradingView. קרא עוד בתנאים וההגבלות.
כתב ויתור
המידע והפרסומים אינם אמורים להיות, ואינם מהווים, עצות פיננסיות, השקעות, מסחר או סוגים אחרים של עצות או המלצות שסופקו או מאושרים על ידי TradingView. קרא עוד בתנאים וההגבלות.