OPEN-SOURCE SCRIPT
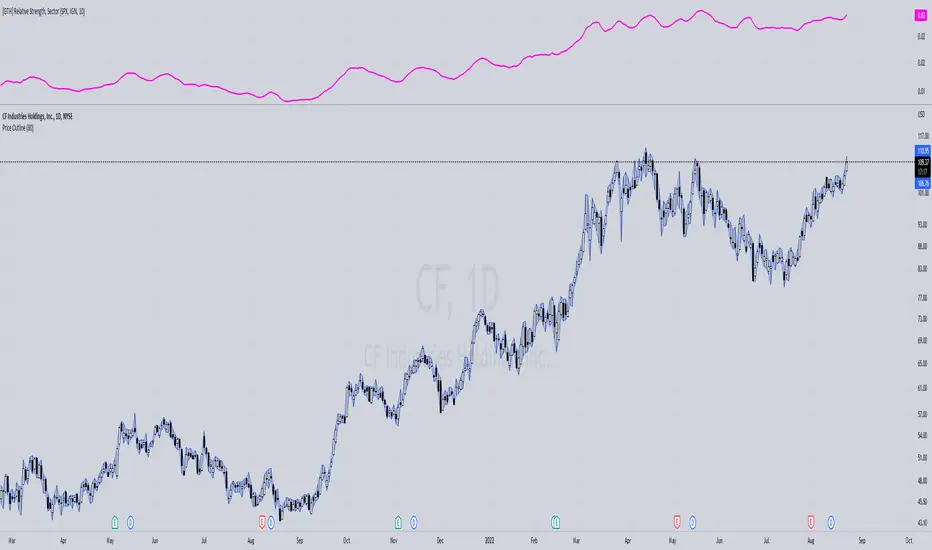
[GTH] Relative Strength, Sectors

Displays the Relative Strength (RS) of a symbol in relation to some common sector ETFs, SPX and NDX (select from drop-down list). This is done by dividing the symbol's price by the chosen sector ETF's price.
You can also select a symbol of your choice to compare against.
Interpretation:
RS line ascending: symbol performs stronger than the sector ETF.
RS line decending: symbol performs weaker than the sector ETF.
In case of error reports: please be specfic. Thanks.
You can also select a symbol of your choice to compare against.
Interpretation:
RS line ascending: symbol performs stronger than the sector ETF.
RS line decending: symbol performs weaker than the sector ETF.
In case of error reports: please be specfic. Thanks.
סקריפט קוד פתוח
ברוח האמיתית של TradingView, יוצר הסקריפט הזה הפך אותו לקוד פתוח, כך שסוחרים יוכלו לעיין בו ולאמת את פעולתו. כל הכבוד למחבר! אמנם ניתן להשתמש בו בחינם, אך זכור כי פרסום חוזר של הקוד כפוף ל־כללי הבית שלנו.
כתב ויתור
המידע והפרסומים אינם מיועדים להיות, ואינם מהווים, ייעוץ או המלצה פיננסית, השקעתית, מסחרית או מכל סוג אחר המסופקת או מאושרת על ידי TradingView. קרא עוד ב־תנאי השימוש.