OPEN-SOURCE SCRIPT
Range supply and demand
Hi all!
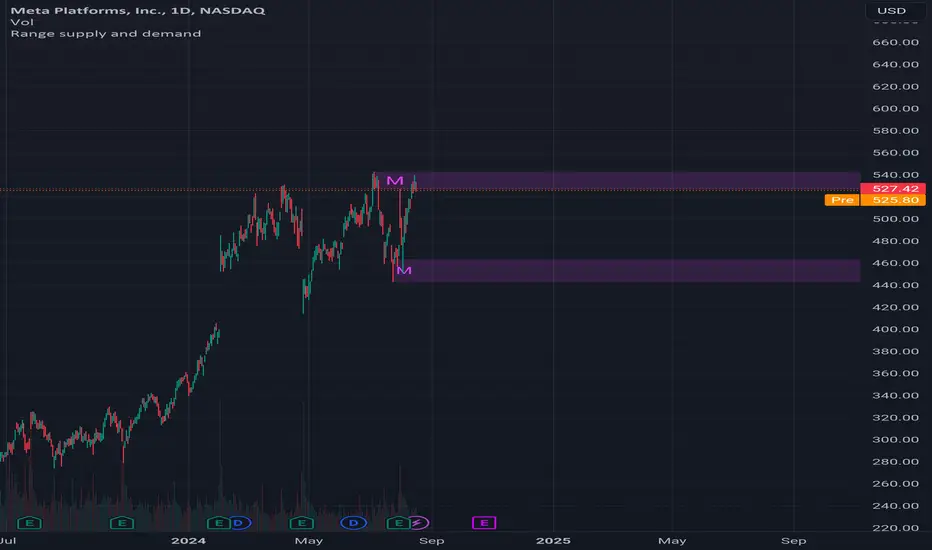
This is a very simple indicator. It plots the high timeframe (configurable via the "Timeframe" setting) high/low current timeframe bars (that has the same high/low as the higher timeframe) as supply/demand. The higher timeframe bar that's chosen is the one that's next last. As of now one high and one low zone is plotted.
The defaults are based on useful zones when on daily candles.
You can choose to display the higher timeframe within the zone via the "Show" option.
Hope this is clear enough, let me know otherwise.
Best of luck trading!
סקריפט קוד פתוח
ברוח האמיתית של TradingView, יוצר הסקריפט הזה הפך אותו לקוד פתוח, כך שסוחרים יוכלו לעיין בו ולאמת את פעולתו. כל הכבוד למחבר! אמנם ניתן להשתמש בו בחינם, אך זכור כי פרסום חוזר של הקוד כפוף ל־כללי הבית שלנו.
כתב ויתור
המידע והפרסומים אינם מיועדים להיות, ואינם מהווים, ייעוץ או המלצה פיננסית, השקעתית, מסחרית או מכל סוג אחר המסופקת או מאושרת על ידי TradingView. קרא עוד ב־תנאי השימוש.