OPEN-SOURCE SCRIPT
Gold Price Trend Overlay
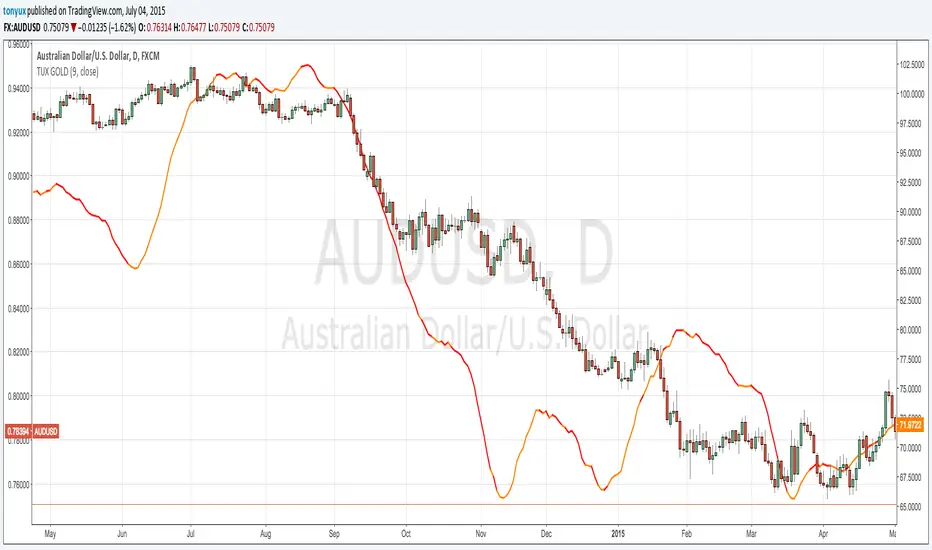
This chart overlay provides the daily 9 SMA of Gold.
If the price of GOLD is ABOVE the 9 SMA then the line will be GOLD
If the price of GOLD is BELOW the 9 SMA then the line will be RED
A good way to use this overlay is by understanding how Gold effects currency pairs.
if GOLD is BULLISH - then AUD/USD is BULLISH
if GOLD is BULLISH - then NZD/USD is BULLISH
if GOLD is BULLISH - then EUR/USD is BULLISH
if GOLD is BULLISH - then USD is bearish
if GOLD is BULLISH - then USD/CHF is BEARISH
if GOLD is BULLISH - then USD/CAD is BEARISH
סקריפט קוד פתוח
ברוח האמיתית של TradingView, יוצר הסקריפט הזה הפך אותו לקוד פתוח, כך שסוחרים יוכלו לעיין בו ולאמת את פעולתו. כל הכבוד למחבר! אמנם ניתן להשתמש בו בחינם, אך זכור כי פרסום חוזר של הקוד כפוף ל־כללי הבית שלנו.
כתב ויתור
המידע והפרסומים אינם מיועדים להיות, ואינם מהווים, ייעוץ או המלצה פיננסית, השקעתית, מסחרית או מכל סוג אחר המסופקת או מאושרת על ידי TradingView. קרא עוד ב־תנאי השימוש.