OPEN-SOURCE SCRIPT
מעודכן MG - Fibonacci Alerts - 1.2

Updated version of: 
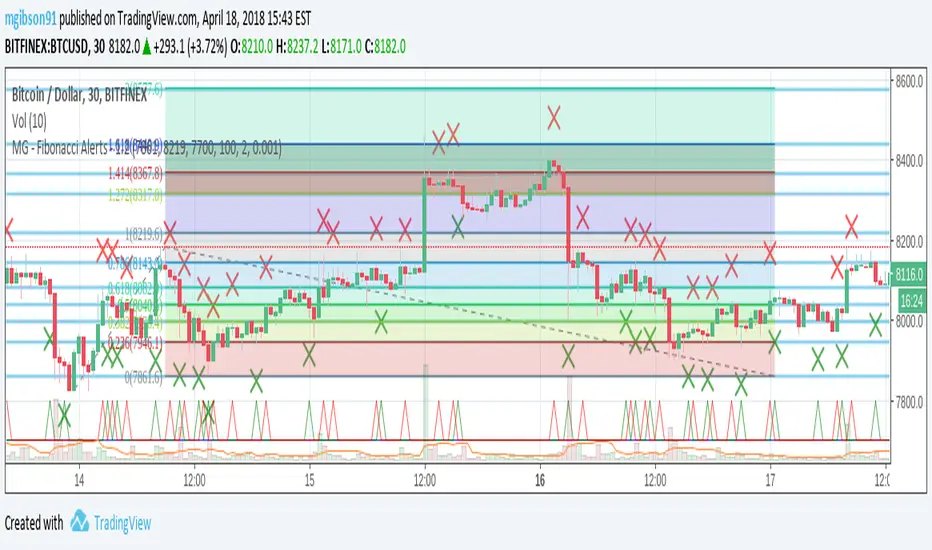
The main change with this version, is that the indicator is now always overlayed and the user has to specify where they want the alerts to be displayed on the chart. (New 'Alert Base' and 'Alert Amplitude' properties define where this is shown in the chart and how large the alert spikes are). It also now includes optional bull and sell markers
This update therefore allows us to:
- Show the Fibonacci Levels being used by the indicator
- Plot buy and sell signals at the correct points on the price chart
- Trigger alerts when price reaches a Fibonacci level (without displaying this on the chart, the indicator can't be overlayed on the main chart)
הערות שחרור
Adding titles to plots for alertsהערות שחרור
Updating imageסקריפט קוד פתוח
ברוח האמיתית של TradingView, יוצר הסקריפט הזה הפך אותו לקוד פתוח, כך שסוחרים יוכלו לעיין בו ולאמת את פעולתו. כל הכבוד למחבר! אמנם ניתן להשתמש בו בחינם, אך זכור כי פרסום חוזר של הקוד כפוף ל־כללי הבית שלנו.
כתב ויתור
המידע והפרסומים אינם מיועדים להיות, ואינם מהווים, ייעוץ או המלצה פיננסית, השקעתית, מסחרית או מכל סוג אחר המסופקת או מאושרת על ידי TradingView. קרא עוד ב־תנאי השימוש.
סקריפט קוד פתוח
ברוח האמיתית של TradingView, יוצר הסקריפט הזה הפך אותו לקוד פתוח, כך שסוחרים יוכלו לעיין בו ולאמת את פעולתו. כל הכבוד למחבר! אמנם ניתן להשתמש בו בחינם, אך זכור כי פרסום חוזר של הקוד כפוף ל־כללי הבית שלנו.
כתב ויתור
המידע והפרסומים אינם מיועדים להיות, ואינם מהווים, ייעוץ או המלצה פיננסית, השקעתית, מסחרית או מכל סוג אחר המסופקת או מאושרת על ידי TradingView. קרא עוד ב־תנאי השימוש.