OPEN-SOURCE SCRIPT
Cumulative Net Volume
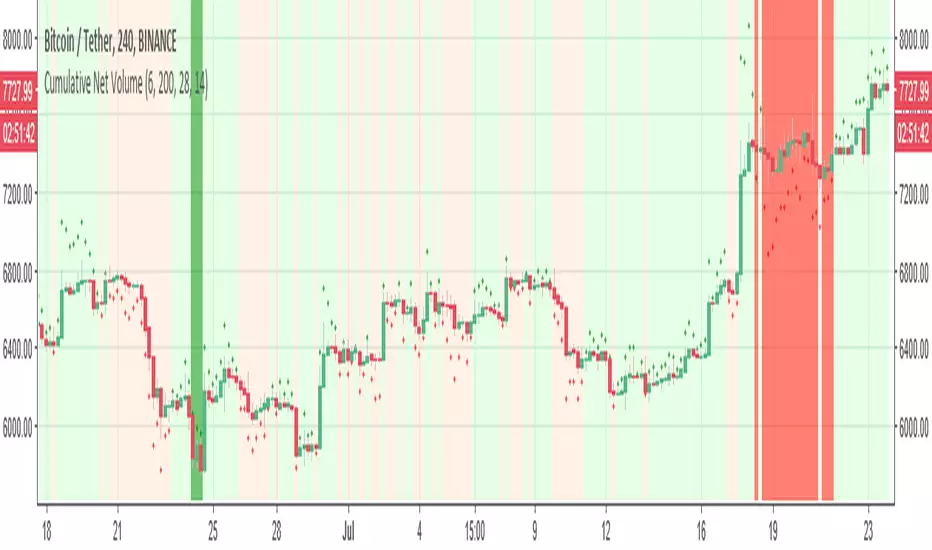
This indicator calculate the Cumulative Net Volume (volume in versus volume out) as seen in red and green cross
I normalize it to be as price indicator -then using color setting it easy to see when volume influx is positive compare to negative period
next step -I add rsi and Bollinger to highlight the area where volume is going up or down with the best period by rsi and Bollinger (green red)
it easy indicator for starter to see where the best buy or sell point
have fun
סקריפט קוד פתוח
ברוח האמיתית של TradingView, יוצר הסקריפט הזה הפך אותו לקוד פתוח, כך שסוחרים יוכלו לעיין בו ולאמת את פעולתו. כל הכבוד למחבר! אמנם ניתן להשתמש בו בחינם, אך זכור כי פרסום חוזר של הקוד כפוף ל־כללי הבית שלנו.
כתב ויתור
המידע והפרסומים אינם מיועדים להיות, ואינם מהווים, ייעוץ או המלצה פיננסית, השקעתית, מסחרית או מכל סוג אחר המסופקת או מאושרת על ידי TradingView. קרא עוד ב־תנאי השימוש.