PROTECTED SOURCE SCRIPT
מעודכן RSI SR by Kred-Allino
Hello Trader,
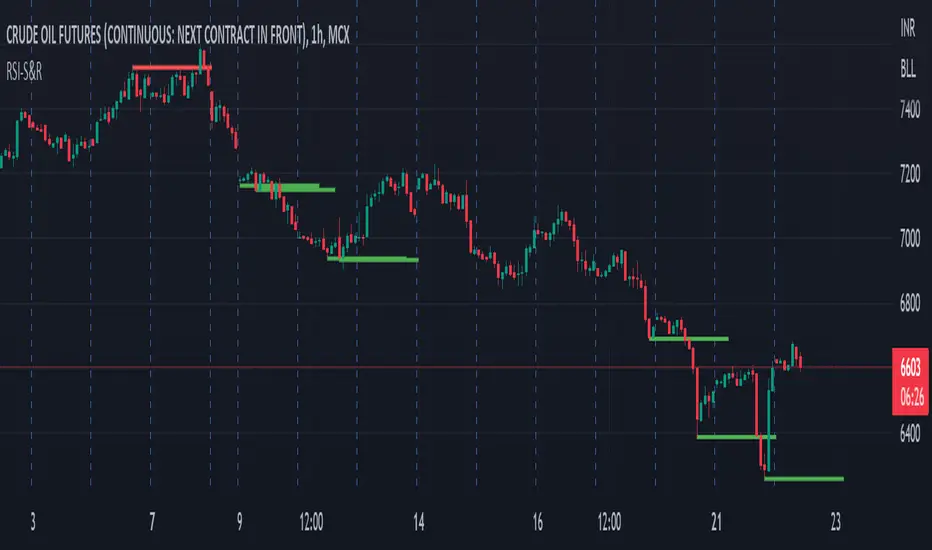
This indicator is draw Support & Resistance Level based on RSI Calculation, It will help you to find Support and Resistance very Easily.
Red Color Line - Resistance
Green Color Line - Support
RSI comes up from the OS region. So it's good time to do the calculation with.
- Find out the lowest RSI value from the RSI array
- Get the corresponding low price from the price array
- Get the corresponding bar_index from bar_index array
- Draw the demand/support line on that price
This Indicator is made for Educational Purpose only, Author will not liable for direct or indirect for any losses due to use of Indicator.
הערות שחרור
Color Changedסקריפט מוגן
סקריפט זה פורסם כמקור סגור. עם זאת, תוכל להשתמש בו בחופשיות וללא כל מגבלות – למד עוד כאן
כתב ויתור
המידע והפרסומים אינם מיועדים להיות, ואינם מהווים, ייעוץ או המלצה פיננסית, השקעתית, מסחרית או מכל סוג אחר המסופקת או מאושרת על ידי TradingView. קרא עוד ב־תנאי השימוש.
סקריפט מוגן
סקריפט זה פורסם כמקור סגור. עם זאת, תוכל להשתמש בו בחופשיות וללא כל מגבלות – למד עוד כאן
כתב ויתור
המידע והפרסומים אינם מיועדים להיות, ואינם מהווים, ייעוץ או המלצה פיננסית, השקעתית, מסחרית או מכל סוג אחר המסופקת או מאושרת על ידי TradingView. קרא עוד ב־תנאי השימוש.