OPEN-SOURCE SCRIPT
מעודכן Original Keltner with Support And Resistance

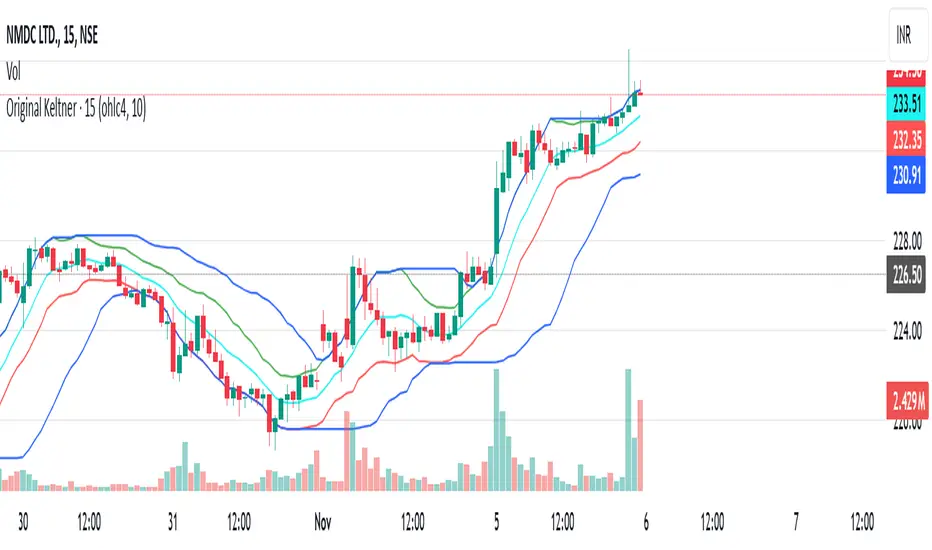
This indicator is based on the original Keltner Channels using typical price and calculating the 10 period average of high - low
Typical price = (high + low + close)/3
In this case, I've taken Typical price as (open + high + low + close)/4 on the advice of John Bollinger from his book Bollinger on Bollinger Bands.
Buy Line = 10 Period Typical Price Average + 10 Period Average of (High - Low)
Sell Line = 10 Period Typical Price Average - 10 Period Average of (High - Low)
This is the basis for the indicator. I've added the highest of the Buy Line and lowest of the Sell Line for the same period which acts as Support and Resistance.
If price is trending below the Lowest of Sell Line, take only sell trades and the Lowest Line acts as resistance.
If price is trending above the Highest of Buy Line, take only buy trades and the Highest Line acts as support.
הערות שחרור
Removed the bool argument since it doesn't get with the indicator's purpose.סקריפט קוד פתוח
ברוח האמיתית של TradingView, יוצר הסקריפט הזה הפך אותו לקוד פתוח, כך שסוחרים יוכלו לעיין בו ולאמת את פעולתו. כל הכבוד למחבר! אמנם ניתן להשתמש בו בחינם, אך זכור כי פרסום חוזר של הקוד כפוף ל־כללי הבית שלנו.
כתב ויתור
המידע והפרסומים אינם מיועדים להיות, ואינם מהווים, ייעוץ או המלצה פיננסית, השקעתית, מסחרית או מכל סוג אחר המסופקת או מאושרת על ידי TradingView. קרא עוד ב־תנאי השימוש.
סקריפט קוד פתוח
ברוח האמיתית של TradingView, יוצר הסקריפט הזה הפך אותו לקוד פתוח, כך שסוחרים יוכלו לעיין בו ולאמת את פעולתו. כל הכבוד למחבר! אמנם ניתן להשתמש בו בחינם, אך זכור כי פרסום חוזר של הקוד כפוף ל־כללי הבית שלנו.
כתב ויתור
המידע והפרסומים אינם מיועדים להיות, ואינם מהווים, ייעוץ או המלצה פיננסית, השקעתית, מסחרית או מכל סוג אחר המסופקת או מאושרת על ידי TradingView. קרא עוד ב־תנאי השימוש.