OPEN-SOURCE SCRIPT
מעודכן Opening Range, Initial Balance, Opening Price
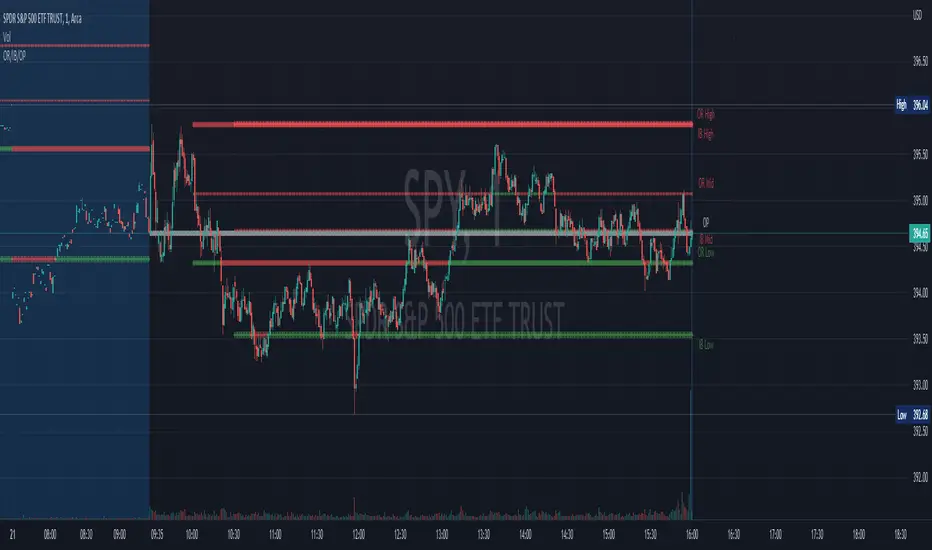
This script draws Opening Range, Initial Balance and Opening Price with options to show mid levels.
By default, lines changes color depending on whether closing price is above or below the lines. Red if price is below, green if price is above.
Colors and line styles are all configurable.
Options to change label positions.
Some definitions:
Opening Range - The opening range is high and low for a given period after the market opens. This period is generally the first 30 or 60 minutes of trading
Initial Balance - WRT to TPO profile chart, the Initial Balance is the price range resulting from the market’s trade during the first two 30 minute periods of the regular trading hours session.
Why is this useful?
The first hour of the trading day is the most active and dynamic period. The price range defined by this period of trading creates some key support / resistance levels for the rest of the day. Example below:
https://www.tradingview.com/x/YdaoqNGa/
הערות שחרור
Updated time zone bug to that it will work properly on futuresהערות שחרור
Added time zone options for sessions time. This allows users to adjust to their local time zone,סקריפט קוד פתוח
ברוח האמיתית של TradingView, יוצר הסקריפט הזה הפך אותו לקוד פתוח, כך שסוחרים יוכלו לעיין בו ולאמת את פעולתו. כל הכבוד למחבר! אמנם ניתן להשתמש בו בחינם, אך זכור כי פרסום חוזר של הקוד כפוף ל־כללי הבית שלנו.
Purchases / Subscriptions / Support - buymeacoffee.com/ptgambler
PayPal - paypal.me/PtGambler
You can reach me privately through my Discord Channel: discord.gg/WMQfaVGyQC
PayPal - paypal.me/PtGambler
You can reach me privately through my Discord Channel: discord.gg/WMQfaVGyQC
כתב ויתור
המידע והפרסומים אינם מיועדים להיות, ואינם מהווים, ייעוץ או המלצה פיננסית, השקעתית, מסחרית או מכל סוג אחר המסופקת או מאושרת על ידי TradingView. קרא עוד ב־תנאי השימוש.
סקריפט קוד פתוח
ברוח האמיתית של TradingView, יוצר הסקריפט הזה הפך אותו לקוד פתוח, כך שסוחרים יוכלו לעיין בו ולאמת את פעולתו. כל הכבוד למחבר! אמנם ניתן להשתמש בו בחינם, אך זכור כי פרסום חוזר של הקוד כפוף ל־כללי הבית שלנו.
Purchases / Subscriptions / Support - buymeacoffee.com/ptgambler
PayPal - paypal.me/PtGambler
You can reach me privately through my Discord Channel: discord.gg/WMQfaVGyQC
PayPal - paypal.me/PtGambler
You can reach me privately through my Discord Channel: discord.gg/WMQfaVGyQC
כתב ויתור
המידע והפרסומים אינם מיועדים להיות, ואינם מהווים, ייעוץ או המלצה פיננסית, השקעתית, מסחרית או מכל סוג אחר המסופקת או מאושרת על ידי TradingView. קרא עוד ב־תנאי השימוש.