OPEN-SOURCE SCRIPT
Custom Candle Body Color and EMA Crossover Indicator
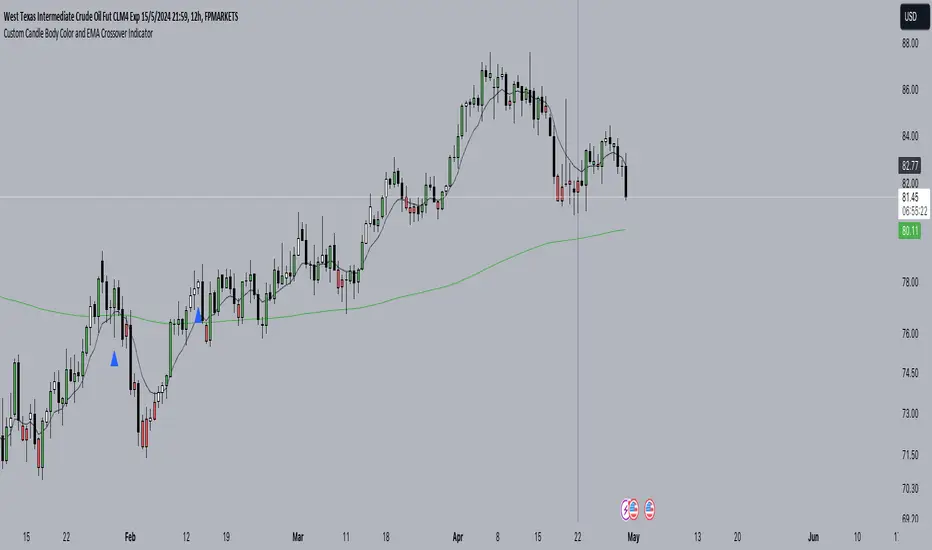
We determine if the price is below EMA 9 by comparing the close price with EMA 9.
We determine if the current candle body is huge compared to the previous candle's body.
We plot EMA 9 in black color and EMA 200 in green color.
We plot blue triangles below the bars for EMA crossover above and red triangles above the bars for EMA crossover below.
We set the color of the candle body to red if the price is below EMA 9 and to green if the price is above EMA 9, only when the current candle body is huge compared to the previous candle's body.
סקריפט קוד פתוח
ברוח האמיתית של TradingView, יוצר הסקריפט הזה הפך אותו לקוד פתוח, כך שסוחרים יוכלו לעיין בו ולאמת את פעולתו. כל הכבוד למחבר! אמנם ניתן להשתמש בו בחינם, אך זכור כי פרסום חוזר של הקוד כפוף ל־כללי הבית שלנו.
כתב ויתור
המידע והפרסומים אינם מיועדים להיות, ואינם מהווים, ייעוץ או המלצה פיננסית, השקעתית, מסחרית או מכל סוג אחר המסופקת או מאושרת על ידי TradingView. קרא עוד ב־תנאי השימוש.