MTF RSI & STOCH Strategy by kzi
This script is a teaml job with Indicator-Johns.
First he used my script, then i transform his code.
The origine:

The first transformation:
www.tradingview.com/u/Indicator-Jones/
Funny moment together, thanks for that. :)
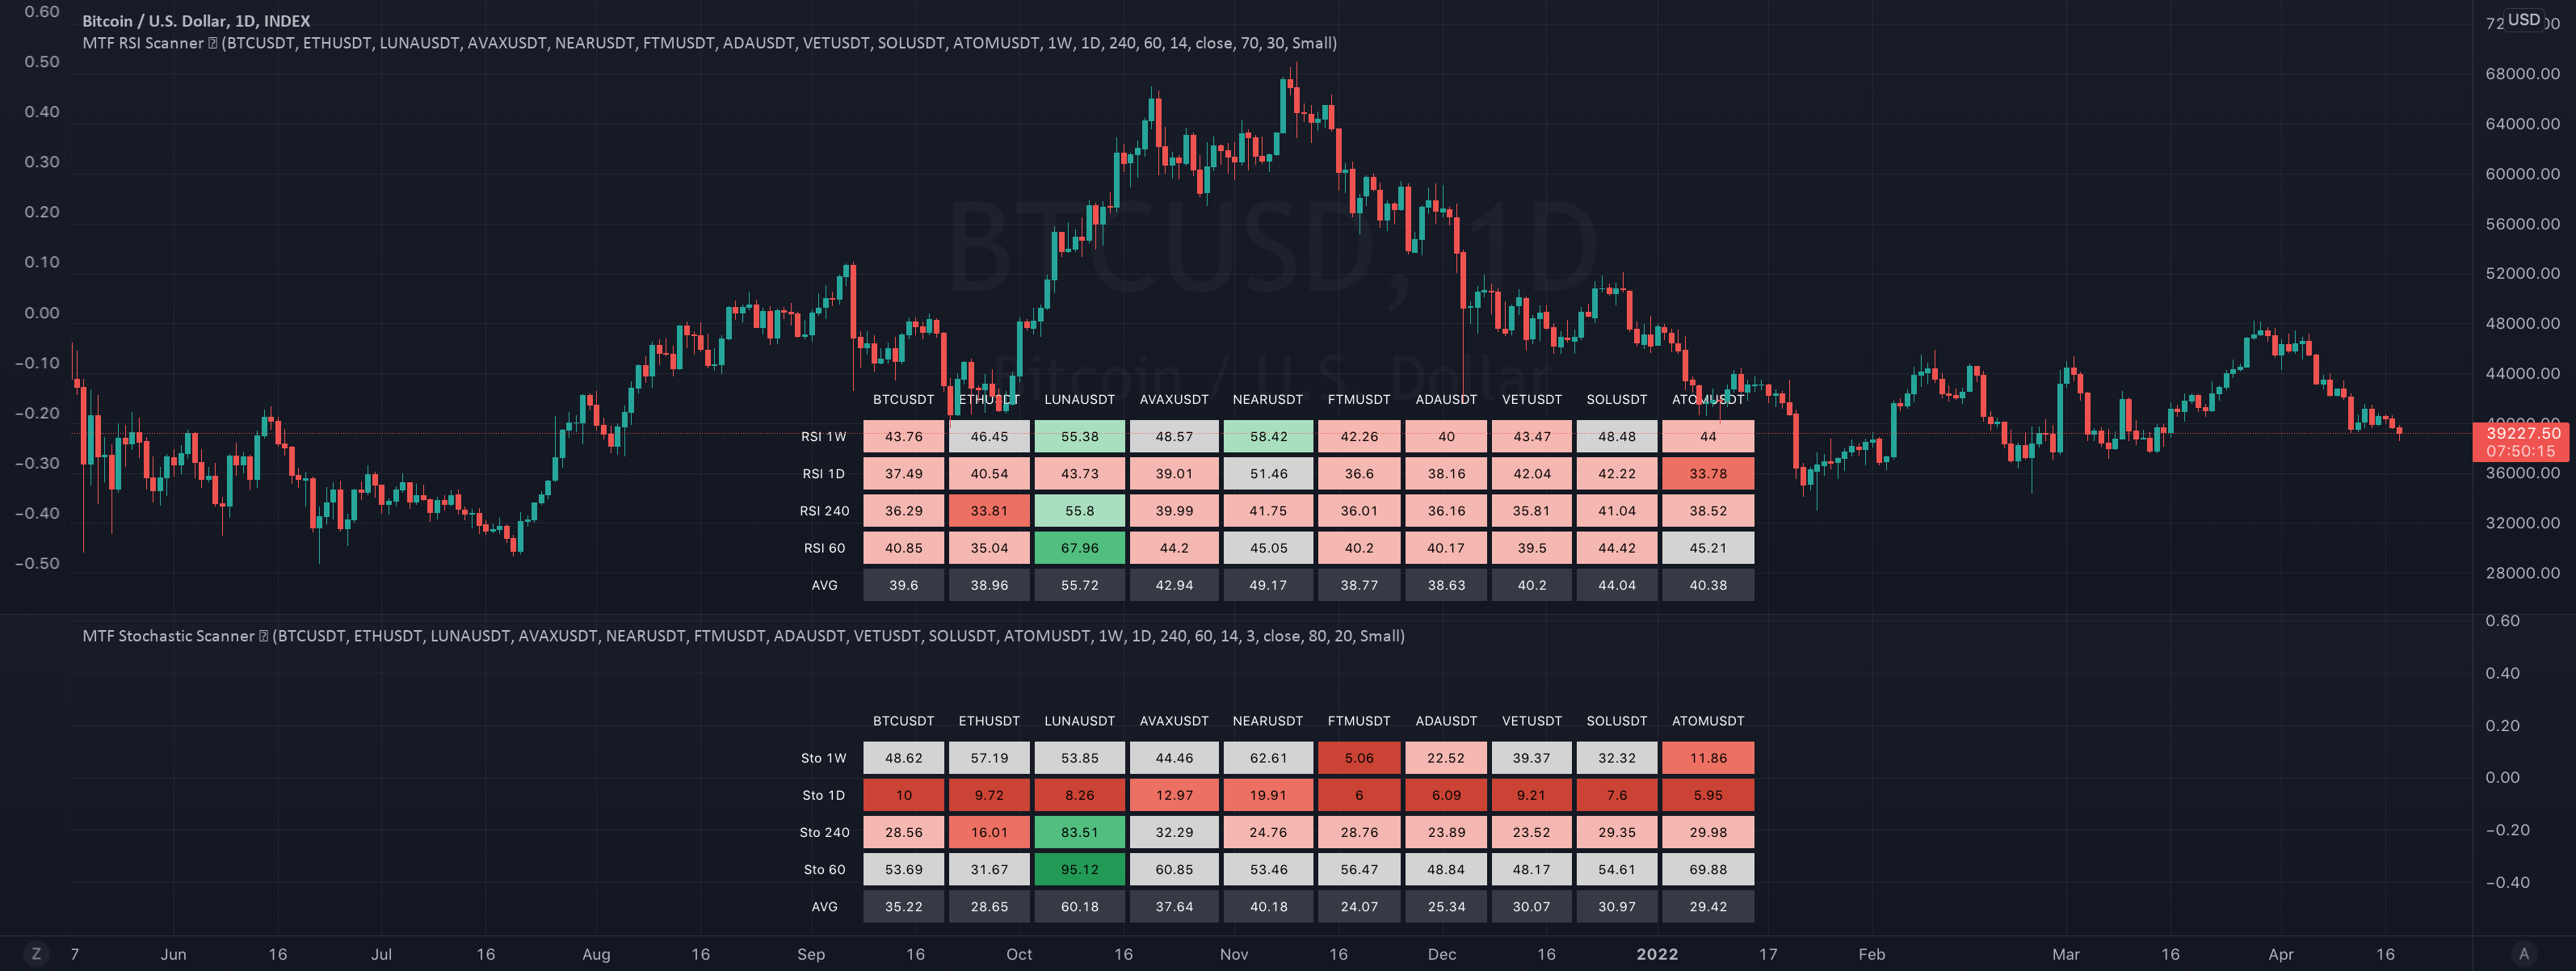
This sharing is an indicator where you can see the average of different time frames.
The RSI is the blue line
The Stock is the yellow line
You can manage the timeframe in the parameters.
The strategy is to take position when the two lines get overbought or oversold and close when the stoch and RSI goes to the middle.
First he used my script, then i transform his code.
The origine:

The first transformation:
www.tradingview.com/u/Indicator-Jones/

Funny moment together, thanks for that. :)
This sharing is an indicator where you can see the average of different time frames.
The RSI is the blue line
The Stock is the yellow line
You can manage the timeframe in the parameters.
The strategy is to take position when the two lines get overbought or oversold and close when the stoch and RSI goes to the middle.