PROTECTED SOURCE SCRIPT
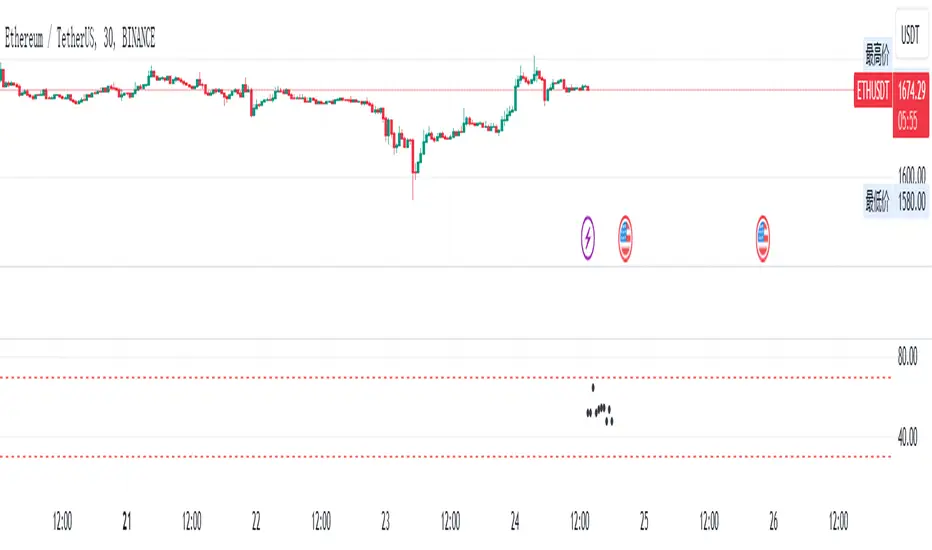
RSI Bitmap

Function (English):
1. It displays 40 items’(tokens,stocks, futures etc.) RSI oversold and overbought data in the form of bitmap/dots on the chart.
2. The specifi item will be clear after placing mouse on the small dots.
3. The bitmap will show red when the RSI overbought, show green when the RSI oversold, and will show black when the RSI in the middle of the value.
RSI点阵图功能(中文):
功能:
1、在图表上以点阵形式、直观的显示40支商品的RSI超卖超买数据
2、如果需要查看具体是什么商品,直接把鼠标放置在小点上就行
3、当RSI超买时点阵显示红色、当RSI超卖时点阵电视绿色、处于中间则显示黑色
סקריפט מוגן
סקריפט זה פורסם כמקור סגור. עם זאת, תוכל להשתמש בו בחופשיות וללא כל מגבלות – למד עוד כאן
כתב ויתור
המידע והפרסומים אינם מיועדים להיות, ואינם מהווים, ייעוץ או המלצה פיננסית, השקעתית, מסחרית או מכל סוג אחר המסופקת או מאושרת על ידי TradingView. קרא עוד ב־תנאי השימוש.
סקריפט מוגן
סקריפט זה פורסם כמקור סגור. עם זאת, תוכל להשתמש בו בחופשיות וללא כל מגבלות – למד עוד כאן
כתב ויתור
המידע והפרסומים אינם מיועדים להיות, ואינם מהווים, ייעוץ או המלצה פיננסית, השקעתית, מסחרית או מכל סוג אחר המסופקת או מאושרת על ידי TradingView. קרא עוד ב־תנאי השימוש.