PROTECTED SOURCE SCRIPT
WMA Killer Ratio Analysis | JeffreyTimmermans

WMA Killer Ratio Analysis
The WMA Killer Ratio Analysis is a highly responsive trend-following indicator designed to deliver quick and actionable insights on the ETHBTC ratio. By utilizing advanced smoothing methods and normalized thresholds, this tool efficiently identifies market trends. Let’s dive into the details:
Core Mechanics
1. Smoothing with Standard Deviations
The WMA Killer Ratio Analysis begins by smoothing source price data using standard deviations, which measure the typical variance in price movements. This creates dynamic deviation levels:
These levels are integrated with the Weighted Moving Average (WMA), filtering out market noise and honing in on significant price shifts.
2. Weighted WMA Bands
The WMA is further refined with dynamic weighting:
This adaptive dual-weighting system highlights potential areas for trend reversals or continuations with precision.
3. Normalized WMA (NWMA) Analysis
Traders can customize long (buy) and short (sell) thresholds to align signal sensitivity with their strategy and market conditions.
Signal Logic
Note: The WMA Killer Ratio Analysis is most effective when paired with other forms of analysis, such as volume, higher time-frame trends, or fundamental data.
Visual Enhancements
The WMA Killer Ratio Analysis emphasizes usability with clear and dynamic plotting features:
Customization Options
The WMA Killer Ratio Analysis combines rigorous mathematical analysis with intuitive visual features, providing traders with a reliable way to identify trends and make data-driven decisions. While it excels at detecting key market shifts, its effectiveness increases when integrated into a broader trading strategy.
-Jeffrey
The WMA Killer Ratio Analysis is a highly responsive trend-following indicator designed to deliver quick and actionable insights on the ETHBTC ratio. By utilizing advanced smoothing methods and normalized thresholds, this tool efficiently identifies market trends. Let’s dive into the details:
Core Mechanics
1. Smoothing with Standard Deviations
The WMA Killer Ratio Analysis begins by smoothing source price data using standard deviations, which measure the typical variance in price movements. This creates dynamic deviation levels:
- Upper Deviation: Marks the high boundary, indicating potential overbought conditions.
- Lower Deviation: Marks the low boundary, signaling potential oversold conditions.
These levels are integrated with the Weighted Moving Average (WMA), filtering out market noise and honing in on significant price shifts.
2. Weighted WMA Bands
The WMA is further refined with dynamic weighting:
- Upper Weight: Expands the WMA, creating an Upper Band to capture extreme price highs.
- Lower Weight: Compresses the WMA, forming a Lower Band to reflect price lows.
This adaptive dual-weighting system highlights potential areas for trend reversals or continuations with precision.
3. Normalized WMA (NWMA) Analysis
- The Normalized WMA adds a deeper layer of trend evaluation: It calculates the percentage change between the source price and its smoothed average. Positive NWMA values suggest overbought conditions, while negative NWMA values point to oversold conditions.
Traders can customize long (buy) and short (sell) thresholds to align signal sensitivity with their strategy and market conditions.
Signal Logic
- Buy (Long) Signals: Triggered when the price remains above the lower deviation level and the NWMA crosses above the long threshold. Indicates a bullish trend and potential upward momentum.
- Sell (Short) Signals: Triggered when the price dips below the upper deviation level and the NWMA falls beneath the short threshold. Suggests bearish momentum and a potential downward trend.
Note: The WMA Killer Ratio Analysis is most effective when paired with other forms of analysis, such as volume, higher time-frame trends, or fundamental data.
Visual Enhancements
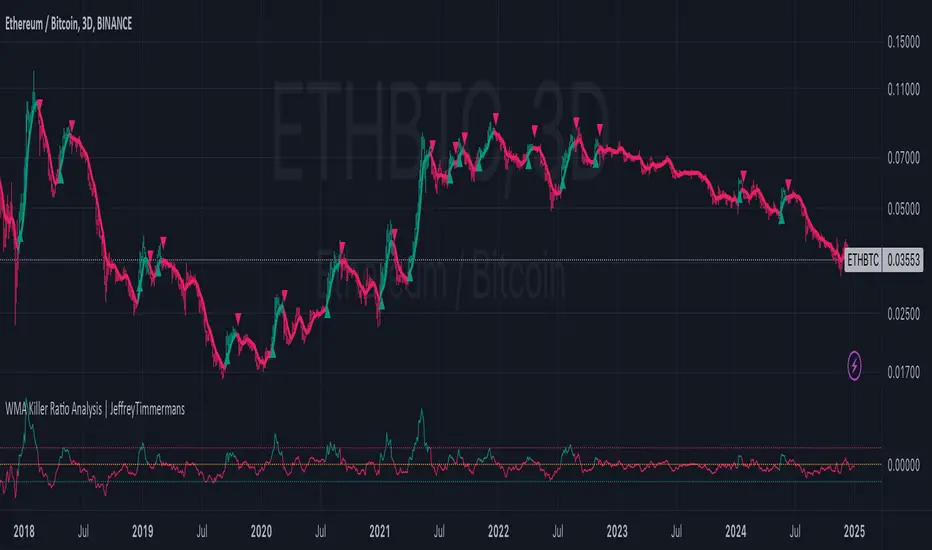
The WMA Killer Ratio Analysis emphasizes usability with clear and dynamic plotting features:
- 1. Color-Coded Trend Indicators: The indicator changes color dynamically to represent trend direction. Users can customize colors to suit specific trading pairs (e.g., ETHBTC, SOLBTC).
- 2. Threshold Markers: Dashed horizontal lines represent long and short thresholds, giving traders a visual reference for signal levels.
- 3. Deviation Bands with Fill Areas: Upper and Lower Bands are plotted around the WMA. Shaded regions highlight deviation zones, making trend boundaries easier to spot.
- 4. Signal Arrows and Bar Coloring: Arrows or triangles appear on the chart to mark potential buy (upward) or sell (downward) points. Candlesticks are color-coded based on the prevailing trend, allowing traders to interpret the market direction at a glance.
Customization Options
- Adjustable Thresholds: Tailor the sensitivity of long and short signals to your strategy.
- Dynamic Weighting: Modify upper and lower band weights to adapt the WMA to varying market conditions.
- Source Selection: Choose the preferred input for price data smoothing, such as closing price or an average (hl2).
The WMA Killer Ratio Analysis combines rigorous mathematical analysis with intuitive visual features, providing traders with a reliable way to identify trends and make data-driven decisions. While it excels at detecting key market shifts, its effectiveness increases when integrated into a broader trading strategy.
-Jeffrey
סקריפט מוגן
סקריפט זה פורסם כמקור סגור. עם זאת, תוכל להשתמש בו בחופשיות וללא כל מגבלות – למד עוד כאן
@JeffreyTimmermans
כתב ויתור
המידע והפרסומים אינם מיועדים להיות, ואינם מהווים, ייעוץ או המלצה פיננסית, השקעתית, מסחרית או מכל סוג אחר המסופקת או מאושרת על ידי TradingView. קרא עוד ב־תנאי השימוש.
סקריפט מוגן
סקריפט זה פורסם כמקור סגור. עם זאת, תוכל להשתמש בו בחופשיות וללא כל מגבלות – למד עוד כאן
@JeffreyTimmermans
כתב ויתור
המידע והפרסומים אינם מיועדים להיות, ואינם מהווים, ייעוץ או המלצה פיננסית, השקעתית, מסחרית או מכל סוג אחר המסופקת או מאושרת על ידי TradingView. קרא עוד ב־תנאי השימוש.