OPEN-SOURCE SCRIPT
מעודכן Original Bravo Swing
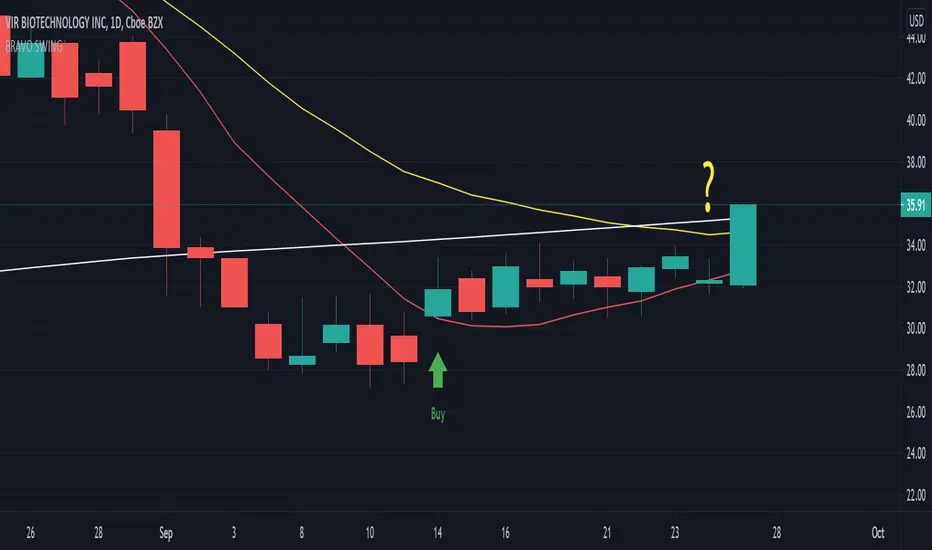
The Bravo Swing is based on the methods taught by YouTube celebrity J Bravo.
It uses the 9 day moving average as a base for selecting optimal entry and exit points.
Buy indicator:
A full candle closing above the 9 day moving average generally indicates a bullish signal for an entry.
If conditions are right, this can be seen as a great opportunity to buy.
Sell indicator:
If the candles continue to close above the 9 day moving average, the trend appears to remain bullish.
However, an exit is to be considered once a candle closes below the 9 day moving average, as this indicates a bearish signal may be approaching.
If you you're feeling confident about the uptrend continuing and choose to ignore the exit signal, a candle close below the 20 day exponential moving average should be used as a definite exit point.
Options:
Color code option to display the 180 day moving average in gray during downtrends and white during an uptrend.
The 50 day moving average can be turned on to help better visualize conflicting trends.
הערות שחרור
The sell indicator now shows ONLY when a red candle closes below the SMA 9 - indicating a strong bearish momentum.A question mark is now displayed when a green candle closes below the SMA 9 - indicating a 'possible' bearish momentum and an early exit should be considered (this can be turned off in settings).
סקריפט קוד פתוח
ברוח האמיתית של TradingView, יוצר הסקריפט הזה הפך אותו לקוד פתוח, כך שסוחרים יוכלו לעיין בו ולאמת את פעולתו. כל הכבוד למחבר! אמנם ניתן להשתמש בו בחינם, אך זכור כי פרסום חוזר של הקוד כפוף ל־כללי הבית שלנו.
כתב ויתור
המידע והפרסומים אינם מיועדים להיות, ואינם מהווים, ייעוץ או המלצה פיננסית, השקעתית, מסחרית או מכל סוג אחר המסופקת או מאושרת על ידי TradingView. קרא עוד ב־תנאי השימוש.