OPEN-SOURCE SCRIPT
מעודכן Mean Reversion

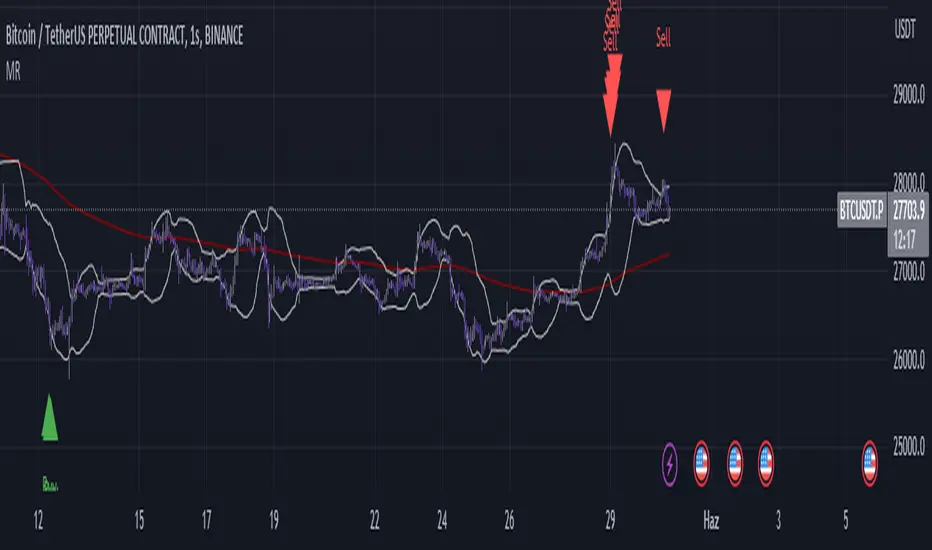
The "Mean Reversion" indicator in this script is a popular trading strategy that is based on the concept that over time, prices tend to move back towards their mean or average. This trading strategy seeks to identify instances where the price has deviated significantly from its mean and therefore presents an opportunity to profit from its eventual reversion to the mean.
The script calculates the distance between the current price and the EMA using the ATR, which is a measure of volatility. By multiplying the ATR by a specified factor, the script establishes a distance between the current price and the EMA. If the price falls below this distance, it triggers a potential buy signal, indicating that the price may be oversold and due for a rebound.
The script also uses Bollinger Bands to help identify potential buying and selling opportunities. The Bollinger Bands are a technical indicator that measures the volatility of an asset by plotting two standard deviations away from a moving average. When the price moves outside of the Bollinger Bands, it can indicate that the asset is overbought or oversold, potentially triggering a buy or sell signal.
The script's "buySignal" variable is triggered when the price is below the EMA by the specified ATR distance and also falls below the lower Bollinger Band. Conversely, the "sellSignal" variable is triggered when the price is above the EMA by the specified ATR distance and also rises above the upper Bollinger Band.
The script plots the EMA, Bollinger Bands, and the buy and sell signals on the chart for easy visualization. Additionally, the script includes alerts that can be set up to notify the user when a buy or sell signal is triggered, so that they can act on the information in a timely manner.
In summary, this script is a Mean Reversion indicator that aims to identify potential opportunities to buy or sell assets based on deviations from their mean price using a combination of the ATR, EMA, and Bollinger Bands.
הערות שחרור
I only changed the colors of the Bollinger Bands and EMA because they were too irritating to me.If you would like to buy me a coffe :)
Usdt TRC20: TAdJKsidFRHfSRsVRDaqwPkdMRrD98X15J
BTC BEP20: 0x02ea27f232495051eb5009fa0130234524303836
סקריפט קוד פתוח
ברוח האמיתית של TradingView, יוצר הסקריפט הזה הפך אותו לקוד פתוח, כך שסוחרים יוכלו לעיין בו ולאמת את פעולתו. כל הכבוד למחבר! אמנם ניתן להשתמש בו בחינם, אך זכור כי פרסום חוזר של הקוד כפוף ל־כללי הבית שלנו.
כתב ויתור
המידע והפרסומים אינם מיועדים להיות, ואינם מהווים, ייעוץ או המלצה פיננסית, השקעתית, מסחרית או מכל סוג אחר המסופקת או מאושרת על ידי TradingView. קרא עוד ב־תנאי השימוש.