OPEN-SOURCE SCRIPT
Momentum Theory Quick Bias
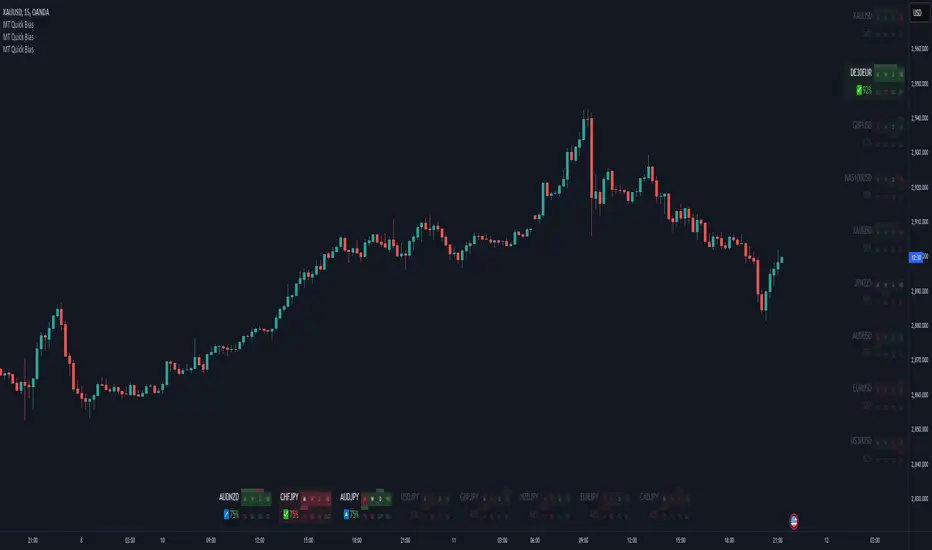
Momentum Theory Quick Bias is a watchlist screener tool for rapid multi-timeframe analysis. It displays a variety of information from higher timeframes in order to set a directional bias including: breakout levels, peak levels, previous bar closes, and swing points.
✅ 8 Symbol Watchlist Scanner
✅ Quickly Set Directional Bias
✅ For Scalpers, Day Traders, and Swing Traders
--- 📷 INDICATOR GALLERY ---


--- 🚀 QUICK LOOK ---
✔ Multi-Timeframe Analysis
Displays various higher timeframe information in order to read how an asset is moving with one quick glance. Utilizes icons and colors that serve as visual cues.

--- ⚡ FEATURES ---
✔ Breakout Bias
Shows if the current price is above or below the breakout level on the timeframe.

✔ Peak Bias
Shows if the current previous peak has been triggered and where price is relative to it.

✔ Previous Bar Close
Shows how the previous bar closed and whether it's bullish or bearish.

✔ Swing Point
Shows if the timeframe has currently flipped its breakout level.

✔ Bias Alignment
Shows visual icons if there is bias alignment between the timeframes.

✔ Quick Analysis
Hover over the symbol name to view which timeframe levels are bullish or bearish and if peak levels have been triggered.

--- 🔥 OTHER FEATURES ---
✔ Built-In Presets
Create your own custom watchlist or use one of the built-in ones (using Oanda charts)

✔ Customized Layouts
Display the watchlist in a variety of different column arrangements.

✔ Dark and Light Modes
Adjustable theme colors to trade your chart the way you want.

✔ Plug-and-Play
Automatically changes the relevant levels depending on the viewed timeframe. Just fill in your watchlist, add it to your chart, and start trading!

--- 📝 HOW TO USE ---
1) Create your watchlist or use one of the built-in presets and place it on the timeframe you want to see. If no watchlist is created, it automatically sets to the current asset.

2) Alignments will trigger in real-time and push to the top of the column.

✅ 8 Symbol Watchlist Scanner
✅ Quickly Set Directional Bias
✅ For Scalpers, Day Traders, and Swing Traders
--- 📷 INDICATOR GALLERY ---
--- 🚀 QUICK LOOK ---
✔ Multi-Timeframe Analysis
Displays various higher timeframe information in order to read how an asset is moving with one quick glance. Utilizes icons and colors that serve as visual cues.
--- ⚡ FEATURES ---
✔ Breakout Bias
Shows if the current price is above or below the breakout level on the timeframe.
✔ Peak Bias
Shows if the current previous peak has been triggered and where price is relative to it.
✔ Previous Bar Close
Shows how the previous bar closed and whether it's bullish or bearish.
[BO] Breakout
[FO] Fakeout
[IN] Inside
[OUT] Outside
✔ Swing Point
Shows if the timeframe has currently flipped its breakout level.
✔ Bias Alignment
Shows visual icons if there is bias alignment between the timeframes.
↗️↘️ Breakout Bias Alignment
🔼🔽 Peak Bias Alignment
🔀 Breakout and Peak Bias Alignment, but opposite
✅ Breakout and Peak Bias Alignment
✔ Quick Analysis
Hover over the symbol name to view which timeframe levels are bullish or bearish and if peak levels have been triggered.
--- 🔥 OTHER FEATURES ---
✔ Built-In Presets
Create your own custom watchlist or use one of the built-in ones (using Oanda charts)
It's recommended to use the same source for all assets in your watchlist whenever possible
✔ Customized Layouts
Display the watchlist in a variety of different column arrangements.
✔ Dark and Light Modes
Adjustable theme colors to trade your chart the way you want.
✔ Plug-and-Play
Automatically changes the relevant levels depending on the viewed timeframe. Just fill in your watchlist, add it to your chart, and start trading!
Set the indicator to the following timeframes to view those arrangements:
- Month Timeframe - Y / 6M / 3M / M
- Week Timeframe - 6M / 3M / M / W
- Day Timeframe - 3M / M / W / D
- H4 Timeframe - Y / M / W / D
- M15 Timeframe - M / W / D / H8
- M10 Timeframe - M / W / D / H4
- M5 Timeframe - W / D / H8 / H2
- M3 Timeframe - W / D / H4 / H1
- M2 Timeframe - D / H8 / H2 / M30
- M1 Timeframe - D / H4 / H1 / M15
--- 📝 HOW TO USE ---
1) Create your watchlist or use one of the built-in presets and place it on the timeframe you want to see. If no watchlist is created, it automatically sets to the current asset.
2) Alignments will trigger in real-time and push to the top of the column.
It is recommended to place the indicator in a different chart window, so it won't have to refresh every time the asset or timeframe changes.
סקריפט קוד פתוח
ברוח האמיתית של TradingView, יוצר הסקריפט הזה הפך אותו לקוד פתוח, כך שסוחרים יוכלו לעיין בו ולאמת את פעולתו. כל הכבוד למחבר! אמנם ניתן להשתמש בו בחינם, אך זכור כי פרסום חוזר של הקוד כפוף ל־כללי הבית שלנו.
🤑 Watch me trade Momentum Theory at youtube.com/@nohypetrader
⚡ Momentum Theory subscription available at whop.com/nohypetrader/
🏆 More Info - patreon.com/posts/momentum-theory-121307513
⚡ Momentum Theory subscription available at whop.com/nohypetrader/
🏆 More Info - patreon.com/posts/momentum-theory-121307513
כתב ויתור
המידע והפרסומים אינם מיועדים להיות, ואינם מהווים, ייעוץ או המלצה פיננסית, השקעתית, מסחרית או מכל סוג אחר המסופקת או מאושרת על ידי TradingView. קרא עוד ב־תנאי השימוש.