INVITE-ONLY SCRIPT
MarketReader_Strategy
מעודכן
MarketReader_Strategy is a very useful and advanced indicator:
- It draws buying (green) and selling (orange) zone.
-Once the buying or selling zone is tapped, the color is automatically changed to grey
-It shows liquidity pool ($$$) engineered by market behaviour
Buying or selling area are determined by an algorithm that combines volume profile, Elliott Wave principles and order flow delivery.
On the above example:
At “1”, you can see that the first buying zone is drawn since January 12
At “2”, the buying zone is tapped on January 18 with a strong bullish reaction.
At “3” and “3’”, you can see that liquidity pool has been created by market maker on both buying and selling side. It is typical of market behavior.
Market maker will take the downside liquidity by targeting the buying zone and then reverse (to the upside) targeting the upside liquidity pool that fuel the pump to the selling zone “4”. This selling zone is reached at “5” with a strong bearish reaction.
“6” represent active buying zone, waiting to be tapped.
To buy or take profit on these areas will depend on market behavior on the way down. Does the market engineer liquidity before? We use 2 complementary indicators helping us to take position on these areas but feel free to experiment with your own.
Usually, I wait price comes to selling or buying zone, then I go on lower timeframe (15 to 30 times lower) searching for divergences and convergences on Momemtum reader (also available on tradingview)
This indicator does not repaint and works on Forex, Crypto, Indices, Commodities and stock.
הערות שחרור
Minor bug correctionהערות שחרור
Minor bug correctionהערות שחרור
Major update:-Optimisation of Orderblock/POI/Supply/demand zone filtering
-Adding FVG-Imbalance plotting
-Automatic plot of Asian range High-Low and its SD (S1-2 R1-2)
-Automatic plot of London High-Low
-Automatic plot of Previous Daily and Weekly High and Low
-Automatic plot of Liquidity pool ($ symbol)
So many people think that POI/OB/Supply-Demand zone are just the last bullish or bearish candle but it is more complicated than that. Our algorithm performs an advanced filtering according to volume, market structure, and oderflow.
All options are customizable.
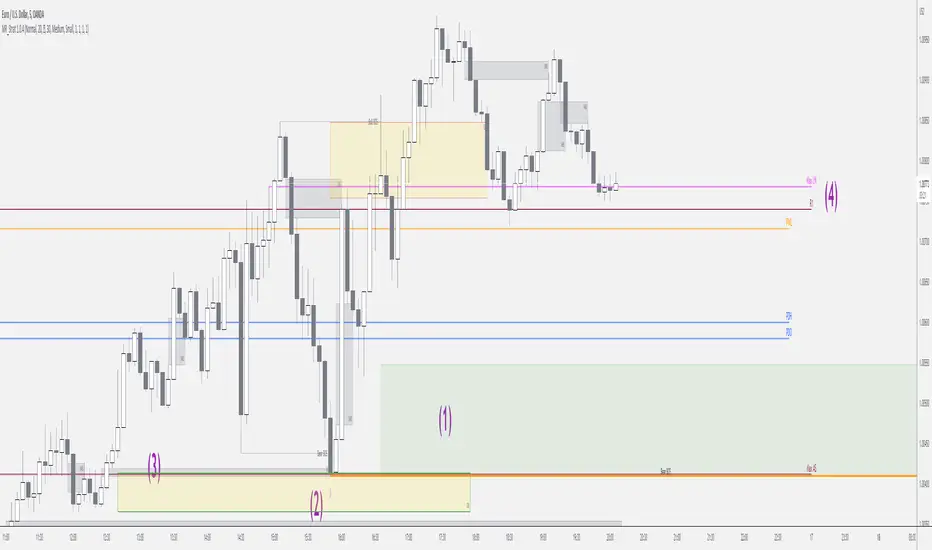
in the graph:
(1) Untouched OrderBlock/POI/etc
(2) Consummed OrderBloc/POI/etc => Nice bounce on it ;-)
(3) Imbalance juste above OB
(4) London and Asian High-Low// Previous daily and Weekly High-Low
הערות שחרור
Minor update:-correction of Volatility support and resistance
-Add option
סקריפט להזמנה בלבד
הגישה לסקריפט זה מוגבלת למשתמשים שהוסמכו על ידי הכותב ובדרך כלל דורשת תשלום. אתה יכול להוסיף אותו למועדפים שלך, אך תוכל להשתמש בו רק לאחר שתבקש אישור ותקבל אותו מהמחבר שלו. למידע נוסף, צור קשר עם nonobdx, או עקוב אחר הוראות המחבר למטה.
TradingView לא מציעה לשלם עבור סקריפט ולהשתמש בו אלא אם כן אתה סומך ב-100% על המחבר שלו ומבין כיצד הסקריפט עובד. במקרים רבים, אתה יכול למצוא אלטרנטיבה טובה לקוד פתוח בחינם בבסקריפטים הקהילתיים שלנו.
רוצה להשתמש בסקריפ זה בגרף?
אזהרה: נא לקרוא לפני בקשת גישה.
Apprendre la méthode:
discord.gg/b7YGtY2
Site internet: marketreader.fr/
Chaine Youtube : youtube.com/channel/UC-a7p8DkfbDM6ONrTzsaErA?view_as=subscriber
discord.gg/b7YGtY2
Site internet: marketreader.fr/
Chaine Youtube : youtube.com/channel/UC-a7p8DkfbDM6ONrTzsaErA?view_as=subscriber
כתב ויתור
המידע והפרסומים אינם אמורים להיות, ואינם מהווים, עצות פיננסיות, השקעות, מסחר או סוגים אחרים של עצות או המלצות שסופקו או מאושרים על ידי TradingView. קרא עוד בתנאים וההגבלות.