OPEN-SOURCE SCRIPT
Alferow_2active_correlation

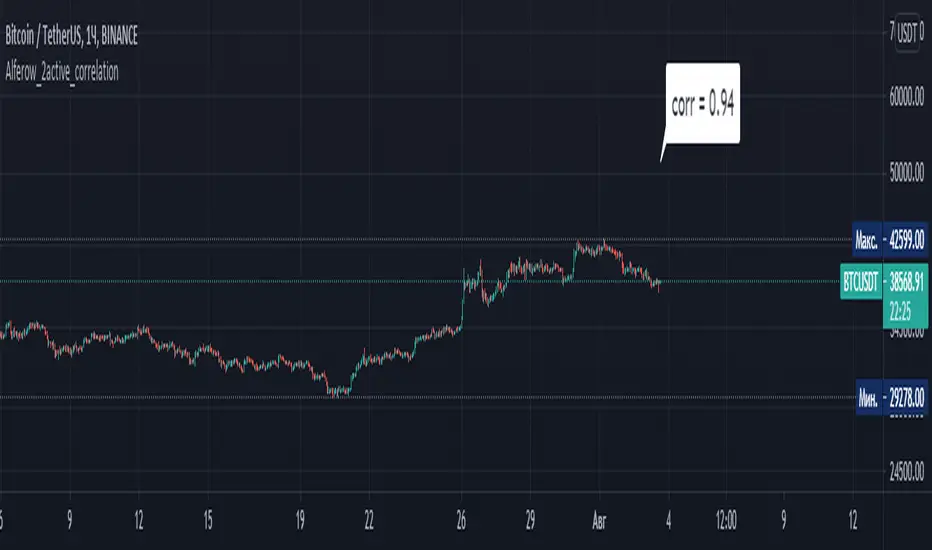
An indicator showing the coefficient of linear correlation between two assets for the selected period. As the initial data, the following are set: the indicator of the candle, according to which the calculation is made (maximum, minimum, closing or opening); the period for analysis; two assets between which the correlation is considered. The output is a label with the value of the correlation coefficient.
סקריפט קוד פתוח
ברוח האמיתית של TradingView, יוצר הסקריפט הזה הפך אותו לקוד פתוח, כך שסוחרים יוכלו לעיין בו ולאמת את פעולתו. כל הכבוד למחבר! אמנם ניתן להשתמש בו בחינם, אך זכור כי פרסום חוזר של הקוד כפוף ל־כללי הבית שלנו.
כתב ויתור
המידע והפרסומים אינם מיועדים להיות, ואינם מהווים, ייעוץ או המלצה פיננסית, השקעתית, מסחרית או מכל סוג אחר המסופקת או מאושרת על ידי TradingView. קרא עוד ב־תנאי השימוש.