Kundalini
Here is how Dominator is calculated:
1. The study estimates the price projected for the next bar. The estimated price is based on the algorithm method.
2. The study extrapolates this value to find a projected price change for the next bar.
The resulting extrapolated value is shown as a histogram on a lower subgraph. By default, sections of the histogram where the extrapolated value is increasing are shown in green; sections corresponding to the decreasing value are shown in red.
Note: Value projection is purely mathematical as all calculations are based on algorithm averaging of previous values.
Overlay True
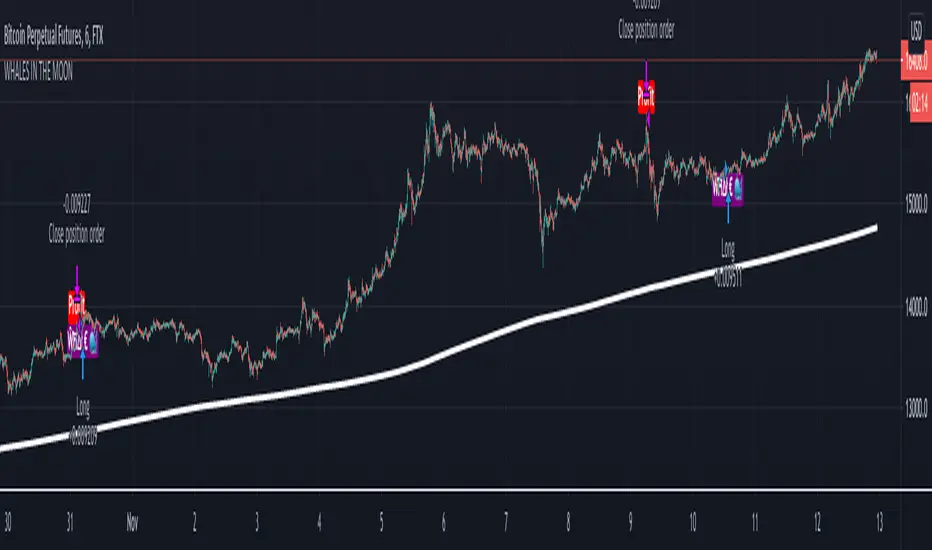
The strategy includes 3 different adjustable levels for the ladder , plus automatic adjustable stop loss and takes profit calculated from your average entry price after each ladder adds.
Adjustable BAcktest Window.
1 long signals
3 ladder long add signals
1 short signals
3 ladder short add signals
1 dynamic stop calculated from your average entry price
1 dynamic take profit calculated from your average entry price
Please Private Msg me if you like more info about the script Full pdf available or if you need access to it
thx for your time and support
סקריפט להזמנה בלבד
רק משתמשים שאושרו על ידי המחבר יכולים לגשת לסקריפט הזה. יהיה עליך לשלוח בקשת גישה ולקבל אישור לשימוש. בדרך כלל, הגישה ניתנת לאחר תשלום. למידע נוסף, עקוב אחר ההוראות של היוצר בהמשך או צור קשר עם Shenl0ng ישירות.
TradingView לא ממליצה לשלם עבור סקריפט או להשתמש בו אלא אם כן אתה סומך לחלוטין על המחבר שלו ומבין כיצד הוא פועל. ייתכן שתוכל גם למצוא חלופות חינמיות וקוד פתוח ב-סקריפטים הקהילתיים שלנו.
הוראות המחבר
כתב ויתור
סקריפט להזמנה בלבד
רק משתמשים שאושרו על ידי המחבר יכולים לגשת לסקריפט הזה. יהיה עליך לשלוח בקשת גישה ולקבל אישור לשימוש. בדרך כלל, הגישה ניתנת לאחר תשלום. למידע נוסף, עקוב אחר ההוראות של היוצר בהמשך או צור קשר עם Shenl0ng ישירות.
TradingView לא ממליצה לשלם עבור סקריפט או להשתמש בו אלא אם כן אתה סומך לחלוטין על המחבר שלו ומבין כיצד הוא פועל. ייתכן שתוכל גם למצוא חלופות חינמיות וקוד פתוח ב-סקריפטים הקהילתיים שלנו.