PROTECTED SOURCE SCRIPT
Khate ravand

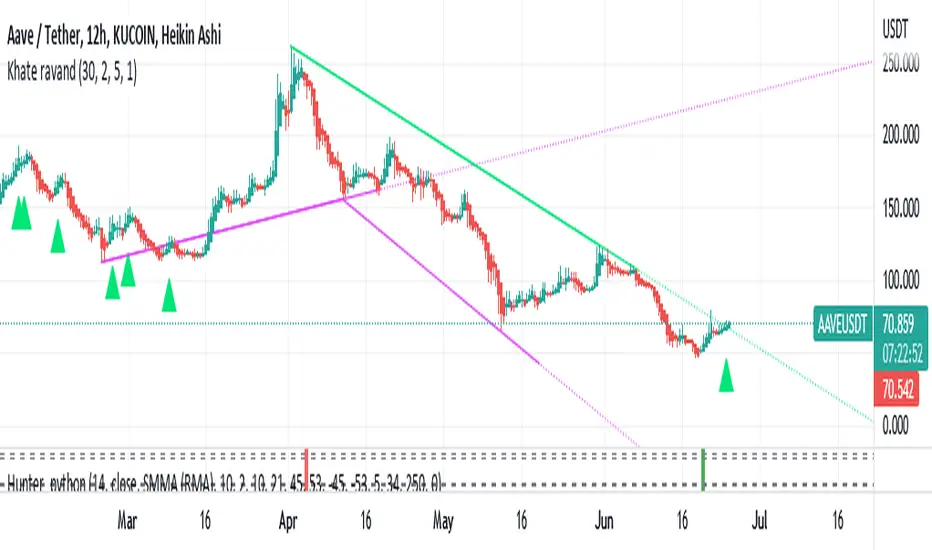
This script draws trendlines from the pivot points in the price chart.
//
// The input for the function that draws the trendlines is any calculation or function
// (here this is pivot points, but the core of the script can be used in other implementations too),
// that most of the time and occasionally produces a 'non n/a' value.
// The trendline function then connects the non n/a values and extends the connections of those points in a trendline.
//
// There is an option to draw the lines from the wicks or from the 'real bodies' of the candles.
// The trendlines can either extend infinitely or only run for an adjustable amount of bars.
//
// There's an option to display trendline breaks
// And the option to display trendlines in color or monochrome
//
//
// The input for the function that draws the trendlines is any calculation or function
// (here this is pivot points, but the core of the script can be used in other implementations too),
// that most of the time and occasionally produces a 'non n/a' value.
// The trendline function then connects the non n/a values and extends the connections of those points in a trendline.
//
// There is an option to draw the lines from the wicks or from the 'real bodies' of the candles.
// The trendlines can either extend infinitely or only run for an adjustable amount of bars.
//
// There's an option to display trendline breaks
// And the option to display trendlines in color or monochrome
//
סקריפט מוגן
סקריפט זה פורסם כמקור סגור. עם זאת, תוכל להשתמש בו בחופשיות וללא כל מגבלות – למד עוד כאן
כתב ויתור
המידע והפרסומים אינם מיועדים להיות, ואינם מהווים, ייעוץ או המלצה פיננסית, השקעתית, מסחרית או מכל סוג אחר המסופקת או מאושרת על ידי TradingView. קרא עוד ב־תנאי השימוש.
סקריפט מוגן
סקריפט זה פורסם כמקור סגור. עם זאת, תוכל להשתמש בו בחופשיות וללא כל מגבלות – למד עוד כאן
כתב ויתור
המידע והפרסומים אינם מיועדים להיות, ואינם מהווים, ייעוץ או המלצה פיננסית, השקעתית, מסחרית או מכל סוג אחר המסופקת או מאושרת על ידי TradingView. קרא עוד ב־תנאי השימוש.