OPEN-SOURCE SCRIPT
מעודכן MTF Phoenix Table
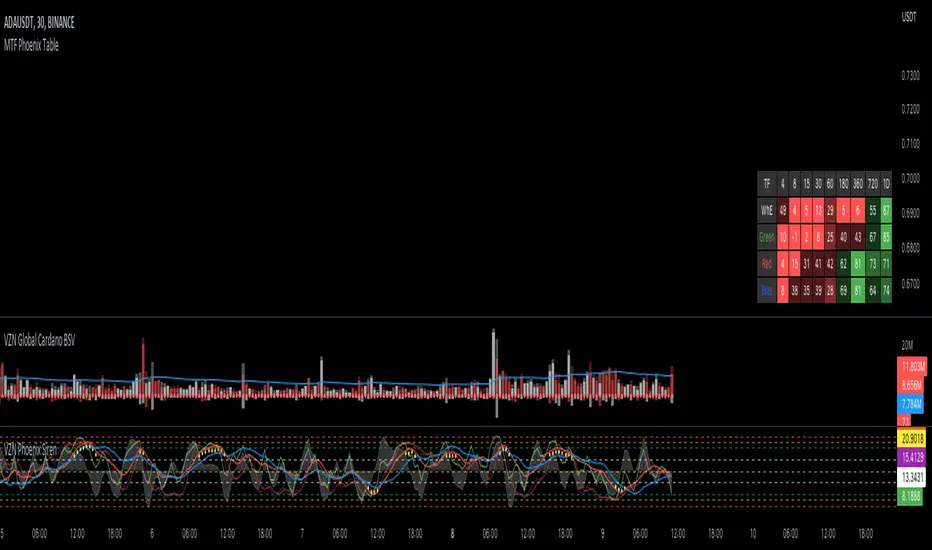
This is a MTF heatmap companion for the Phoenix Ascending indicator by WyckoffMode. It aims to make MTF analysis easier at a quick glance.
The row headings are color coordinated for easy visual recognition.
The row headings are color coordinated for easy visual recognition.
הערות שחרור
I have updated the table so that if a Phoenix Indicator Value in any time frame is currently trending down (relative to the previous bar) the text color in that cell will be fuchsia. Also I made a slight adjustment to two transparency levels for < 50 to help distinguish between them.
הערות שחרור
I reverted the text color change because it seems to have a bug. When the current chart timeframe is higher than the minimum timeframe in the table it doesn't always correctly call if the cell value is rising or falling.הערות שחרור
I was able to discover a fix so the table updated correctly and color the text correctly based on if the current cell value was less than the previous value. The text color that represents a descending value is yellow.הערות שחרור
Cell text color error removedהערות שחרור
As requested by some, I have adjusted the code so that the timeframes in the settings are adjustable and effect the TF header accordingly. All values under the daily will be expressed in minutes, e.g. 12H = 720.סקריפט קוד פתוח
ברוח האמיתית של TradingView, יוצר הסקריפט הזה הפך אותו לקוד פתוח, כך שסוחרים יוכלו לעיין בו ולאמת את פעולתו. כל הכבוד למחבר! אמנם ניתן להשתמש בו בחינם, אך זכור כי פרסום חוזר של הקוד כפוף ל־כללי הבית שלנו.
כתב ויתור
המידע והפרסומים אינם מיועדים להיות, ואינם מהווים, ייעוץ או המלצה פיננסית, השקעתית, מסחרית או מכל סוג אחר המסופקת או מאושרת על ידי TradingView. קרא עוד ב־תנאי השימוש.
סקריפט קוד פתוח
ברוח האמיתית של TradingView, יוצר הסקריפט הזה הפך אותו לקוד פתוח, כך שסוחרים יוכלו לעיין בו ולאמת את פעולתו. כל הכבוד למחבר! אמנם ניתן להשתמש בו בחינם, אך זכור כי פרסום חוזר של הקוד כפוף ל־כללי הבית שלנו.
כתב ויתור
המידע והפרסומים אינם מיועדים להיות, ואינם מהווים, ייעוץ או המלצה פיננסית, השקעתית, מסחרית או מכל סוג אחר המסופקת או מאושרת על ידי TradingView. קרא עוד ב־תנאי השימוש.