OPEN-SOURCE SCRIPT
מעודכן Multi-Timeframe Trend Indicator
"Introducing the Multi-Timeframe Trend Indicator: Your Key to Comprehensive Market Analysis
Are you looking for a powerful tool to enhance your trading decisions? Our Multi-Timeframe Trend Indicator offers a unique perspective on market trends across five crucial timeframes.
Key Features:
1. Comprehensive Analysis: Simultaneously view trends for H1, H4, D1, W, and M timeframes.
2. Easy-to-Read Display: Color-coded table for instant trend recognition.
3. Proven Strategy: Utilizes the reliable EMA7, SMA20, and SMA200 crossover method.
How It Works:
- Bullish Trend: When EMA7 > SMA20 > SMA200
- Bearish Trend: When EMA7 < SMA20 < SMA200
- Neutral Trend: Any other configuration
Benefits:
- Align your trades with multiple timeframe trends
- Identify potential trend reversals early
- Confirm your trading decisions with a quick glance
Whether you're a day trader or a long-term investor, this indicator provides valuable insights to support your trading strategy. By understanding trends across multiple timeframes, you can make more informed decisions and potentially improve your trading results.
Don't let conflicting timeframes confuse your strategy. Get the full picture with our Multi-Timeframe Trend Indicator today!"
הערות שחרור
The Multi-Timeframe Trend Indicator is a powerful tool for technical analysis in financial markets. Here are its main features and uses:## How it works
1. Trend analysis across multiple timeframes:
- H1 (1 hour)
- H4 (4 hours)
- D1 (1 day)
- W (1 week)
- M (1 month)
2. Trend determination based on three moving averages:
- EMA 7 (7-period exponential moving average)
- SMA 20 (20-period simple moving average)
- SMA 200 (200-period simple moving average)
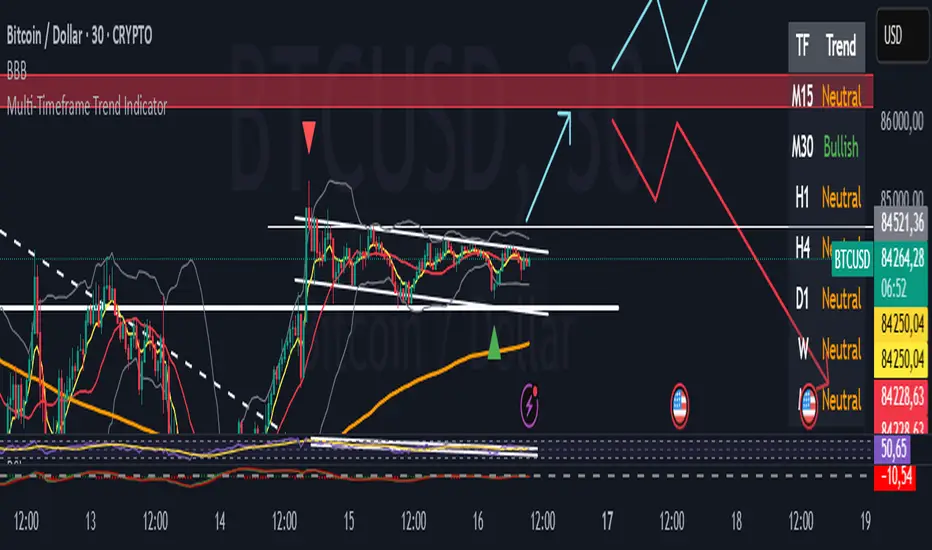
3. Visual display:
- Table in the top right corner of the chart showing the trend for each timeframe
- Plotting of EMA 7, SMA 20, and SMA 200 on the main chart
## Usefulness
1. Global market view:
- Quickly identifies trends across different time scales
- Helps align trading decisions with dominant trends
2. Signal confirmation:
- Alignment of trends across multiple timeframes strengthens signal reliability
3. Risk management:
- Helps identify potential reversal points by observing divergences between different timeframes
4. Precise entries and exits:
- Shorter timeframes can be used to refine entry and exit points once the main trend is identified
5. Adaptability:
- Suitable for different trading styles, from day trading to swing trading
In summary, this indicator provides a comprehensive view of market trends, allowing traders to make more informed decisions that are consistent with price movements across different time scales.
הערות שחרור
The Multi-Timeframe Trend Indicator is a powerful tool for technical analysis in financial markets. Here are its main features and uses:## How it works
1. Trend analysis across multiple timeframes:
- H1 (1 hour)
- H4 (4 hours)
- D1 (1 day)
- W (1 week)
- M (1 month)
2. Trend determination based on three moving averages:
- EMA 7 (7-period exponential moving average)
- SMA 20 (20-period simple moving average)
- SMA 200 (200-period simple moving average)
3. Visual display:
- Table in the top right corner of the chart showing the trend for each timeframe
- Plotting of EMA 7, SMA 20, and SMA 200 on the main chart
## Usefulness
1. Global market view:
- Quickly identifies trends across different time scales
- Helps align trading decisions with dominant trends
2. Signal confirmation:
- Alignment of trends across multiple timeframes strengthens signal reliability
3. Risk management:
- Helps identify potential reversal points by observing divergences between different timeframes
4. Precise entries and exits:
- Shorter timeframes can be used to refine entry and exit points once the main trend is identified
5. Adaptability:
- Suitable for different trading styles, from day trading to swing trading
In summary, this indicator provides a comprehensive view of market trends, allowing traders to make more informed decisions that are consistent with price movements across different time scales.
Thank you.
הערות שחרור
Update V6הערות שחרור
Uptdate minor with M15 and M30סקריפט קוד פתוח
ברוח האמיתית של TradingView, יוצר הסקריפט הזה הפך אותו לקוד פתוח, כך שסוחרים יוכלו לעיין בו ולאמת את פעולתו. כל הכבוד למחבר! אמנם ניתן להשתמש בו בחינם, אך זכור כי פרסום חוזר של הקוד כפוף ל־כללי הבית שלנו.
כתב ויתור
המידע והפרסומים אינם מיועדים להיות, ואינם מהווים, ייעוץ או המלצה פיננסית, השקעתית, מסחרית או מכל סוג אחר המסופקת או מאושרת על ידי TradingView. קרא עוד ב־תנאי השימוש.
סקריפט קוד פתוח
ברוח האמיתית של TradingView, יוצר הסקריפט הזה הפך אותו לקוד פתוח, כך שסוחרים יוכלו לעיין בו ולאמת את פעולתו. כל הכבוד למחבר! אמנם ניתן להשתמש בו בחינם, אך זכור כי פרסום חוזר של הקוד כפוף ל־כללי הבית שלנו.
כתב ויתור
המידע והפרסומים אינם מיועדים להיות, ואינם מהווים, ייעוץ או המלצה פיננסית, השקעתית, מסחרית או מכל סוג אחר המסופקת או מאושרת על ידי TradingView. קרא עוד ב־תנאי השימוש.