OPEN-SOURCE SCRIPT
מעודכן VEMA_LTF

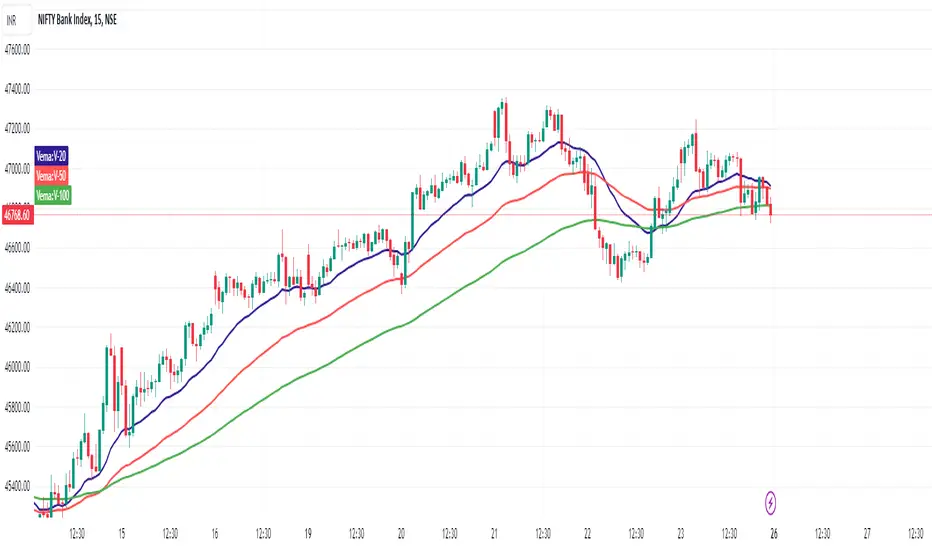
VEMA indicator is based on lower time frame volume data and it has 3 lines.
20, 50, 100 moving averages of the close price in each candle with the highest volume.
Effectively working fine and hence sharing.
Will Add more information with examples in next update
20, 50, 100 moving averages of the close price in each candle with the highest volume.
Effectively working fine and hence sharing.
Will Add more information with examples in next update
הערות שחרור
The script changed from a default 10-second time frame to 1-minute time frame. In case our subscription to TV supports sec based time frame - please set it to 10 sec.
In general observation on any time frame:
If the price crosses all three lines and closes above or below 20-VEMA, we can see good movement in the same direction in short period of time.
Analyze more charts with different time frames along with your favorite indicator and VEMA lines.
הערות שחרור
Minor correction as per coding guidelinesסקריפט קוד פתוח
ברוח האמיתית של TradingView, יוצר הסקריפט הזה הפך אותו לקוד פתוח, כך שסוחרים יוכלו לעיין בו ולאמת את פעולתו. כל הכבוד למחבר! אמנם ניתן להשתמש בו בחינם, אך זכור כי פרסום חוזר של הקוד כפוף ל־כללי הבית שלנו.
כתב ויתור
המידע והפרסומים אינם מיועדים להיות, ואינם מהווים, ייעוץ או המלצה פיננסית, השקעתית, מסחרית או מכל סוג אחר המסופקת או מאושרת על ידי TradingView. קרא עוד ב־תנאי השימוש.
סקריפט קוד פתוח
ברוח האמיתית של TradingView, יוצר הסקריפט הזה הפך אותו לקוד פתוח, כך שסוחרים יוכלו לעיין בו ולאמת את פעולתו. כל הכבוד למחבר! אמנם ניתן להשתמש בו בחינם, אך זכור כי פרסום חוזר של הקוד כפוף ל־כללי הבית שלנו.
כתב ויתור
המידע והפרסומים אינם מיועדים להיות, ואינם מהווים, ייעוץ או המלצה פיננסית, השקעתית, מסחרית או מכל סוג אחר המסופקת או מאושרת על ידי TradingView. קרא עוד ב־תנאי השימוש.