OPEN-SOURCE SCRIPT
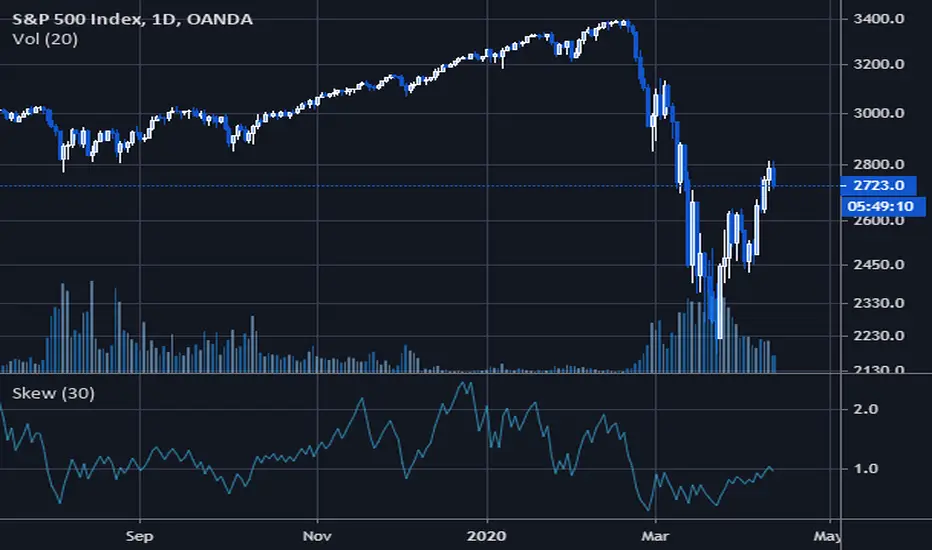
Volatility Skew

This indicator measure the historical skew of actual volatility for an individual security. It measure the volatility of up moves versus down moves over the period and gives a ratio. When the indicator is greater than one, it indicators that volatility is greater to the upside, when it is below 1 it indicates that volatility is skewed to the downside.
This is not comparable to the SKEW index, since that measures the implied volatility across option strikes, rather than using historical volatility.
This is not comparable to the SKEW index, since that measures the implied volatility across option strikes, rather than using historical volatility.
סקריפט קוד פתוח
ברוח האמיתית של TradingView, יוצר הסקריפט הזה הפך אותו לקוד פתוח, כך שסוחרים יוכלו לעיין בו ולאמת את פעולתו. כל הכבוד למחבר! אמנם ניתן להשתמש בו בחינם, אך זכור כי פרסום חוזר של הקוד כפוף ל־כללי הבית שלנו.
Software Engineer and FX, Options, Crypto Trader. Previously worked at large options market maker. If you like my scripts and would like to donate:
Bitcoin: 179ETrGo3FCVcnBV8i1uc4J8YHFRknYytz
Eth: 0x73d59A8214FD70053aF37E9700692e25de441245
Bitcoin: 179ETrGo3FCVcnBV8i1uc4J8YHFRknYytz
Eth: 0x73d59A8214FD70053aF37E9700692e25de441245
כתב ויתור
המידע והפרסומים אינם מיועדים להיות, ואינם מהווים, ייעוץ או המלצה פיננסית, השקעתית, מסחרית או מכל סוג אחר המסופקת או מאושרת על ידי TradingView. קרא עוד ב־תנאי השימוש.