OPEN-SOURCE SCRIPT
Volatility % Bands (O→C)
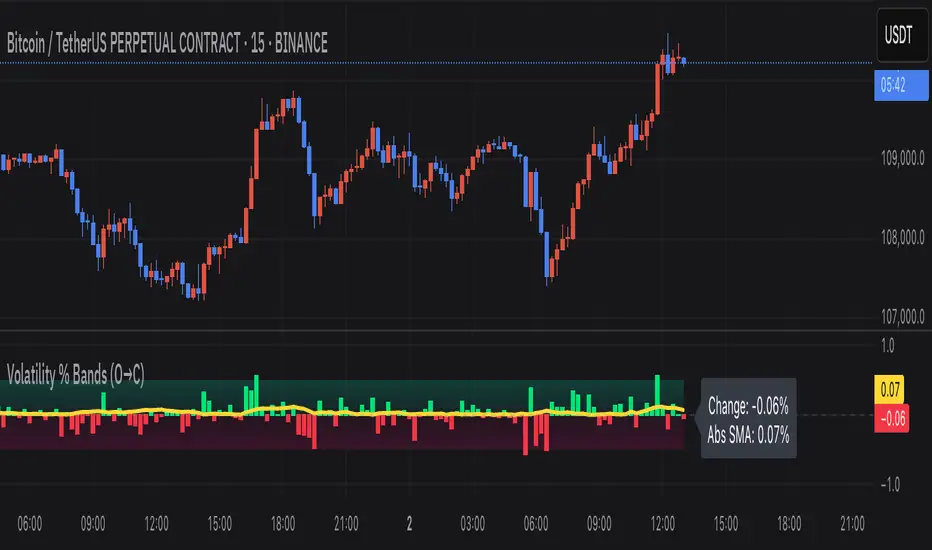
Volatility % Bands (O→C) is an indicator designed to visualize the percentage change from Open to Close of each candle, providing a clear view of short-term momentum and volatility.
This tool can be useful for volatility breakout strategies, day trading, and short-term momentum analysis.
- **Histogram**: Displays bar-by-bar % change (Close vs Open). Green bars indicate positive changes, while red bars indicate negative ones, making momentum shifts easy to identify.
- **Moving Average Line**: Plots the Simple Moving Average (SMA) of the absolute % change, helping traders track the average volatility over a chosen period.
- **Background Bands**: Based on the user-defined Level Step, ±1 to ±5 zones are highlighted as shaded bands, allowing quick recognition of whether volatility is low, moderate, or extreme.
- **Label**: Shows the latest candle’s % change and the current SMA value as a floating label on the right, making it convenient for real-time monitoring.
This tool can be useful for volatility breakout strategies, day trading, and short-term momentum analysis.
סקריפט קוד פתוח
ברוח האמיתית של TradingView, יוצר הסקריפט הזה הפך אותו לקוד פתוח, כך שסוחרים יוכלו לעיין בו ולאמת את פעולתו. כל הכבוד למחבר! אמנם ניתן להשתמש בו בחינם, אך זכור כי פרסום חוזר של הקוד כפוף ל־כללי הבית שלנו.
비트코인 선물 매매를 2년 정도 했으며, 수익 추구도 좋지만 시장 분석 자체를 즐겨하는 편입니다.
כתב ויתור
המידע והפרסומים אינם מיועדים להיות, ואינם מהווים, ייעוץ או המלצה פיננסית, השקעתית, מסחרית או מכל סוג אחר המסופקת או מאושרת על ידי TradingView. קרא עוד ב־תנאי השימוש.