PROTECTED SOURCE SCRIPT
Trend Table MTF – Customizable PRO
Trend Table MTF – Customizable PRO
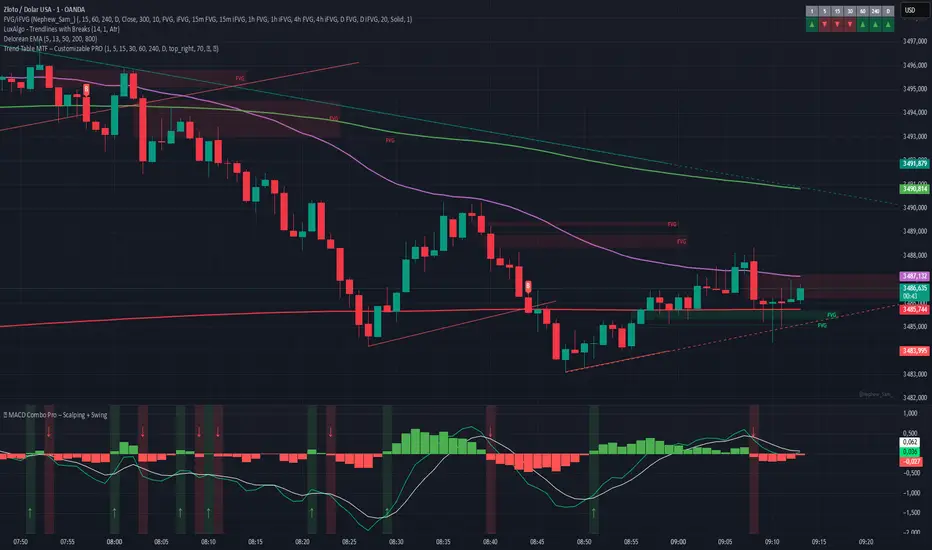
The Trend Table MTF – Customizable PRO is a powerful visual tool that helps traders instantly monitor multi-timeframe trend direction using a simple and clean table display.
Perfect for scalpers, intraday, and swing traders, this indicator offers a bird’s eye view of the market trend across multiple timeframes – all in a compact format.
🔍 Features:
✅ 7 Timeframes (fully customizable: 1m, 5m, 15m, 30m, 1h, 4h, 1D by default)
✅ Trend Detection via price vs EMA 20 (customizable logic possible)
✅ Custom Table Positioning (Top/Bottom, Left/Right)
✅ Adjustable Background Transparency
✅ Fully Customizable Colors:
Background
Text
Uptrend Arrow Color (▲)
Downtrend Arrow Color (▼)
Uptrend Background Color
Downtrend Background Color
✅ Arrow Symbols for quick trend recognition
✅ Works on any asset and timeframe
🎯 How It Works:
The indicator compares the current price to the 20-period EMA on each selected timeframe.
If Price > EMA, it's considered an Uptrend (▲).
If Price < EMA, it's a Downtrend (▼).
You get immediate color-coded visual feedback in the table with customizable arrows and background colors.
📊 Use Cases:
🔹 Confirm trend alignment before entering trades
🔹 Spot momentum shifts across timeframes
🔹 Combine with your scalping or swing strategy for extra confidence
🔹 Perfect companion to your price action or volume indicators
🧩 Pro Tips:
Combine this with MACD, RSI, or Liquidity Zones for powerful confluence
Use table transparency to avoid visual clutter on your chart
Choose high-contrast colors for quick glance recognition
סקריפט מוגן
סקריפט זה פורסם כמקור סגור. עם זאת, אתה יכול להשתמש בו באופן חופשי וללא כל הגבלה - למד עוד כאן.
כתב ויתור
המידע והפרסומים אינם אמורים להיות, ואינם מהווים, עצות פיננסיות, השקעות, מסחר או סוגים אחרים של עצות או המלצות שסופקו או מאושרים על ידי TradingView. קרא עוד בתנאים וההגבלות.
סקריפט מוגן
סקריפט זה פורסם כמקור סגור. עם זאת, אתה יכול להשתמש בו באופן חופשי וללא כל הגבלה - למד עוד כאן.
כתב ויתור
המידע והפרסומים אינם אמורים להיות, ואינם מהווים, עצות פיננסיות, השקעות, מסחר או סוגים אחרים של עצות או המלצות שסופקו או מאושרים על ידי TradingView. קרא עוד בתנאים וההגבלות.