OPEN-SOURCE SCRIPT
מעודכן ATR Trailing Stop by ceyhun
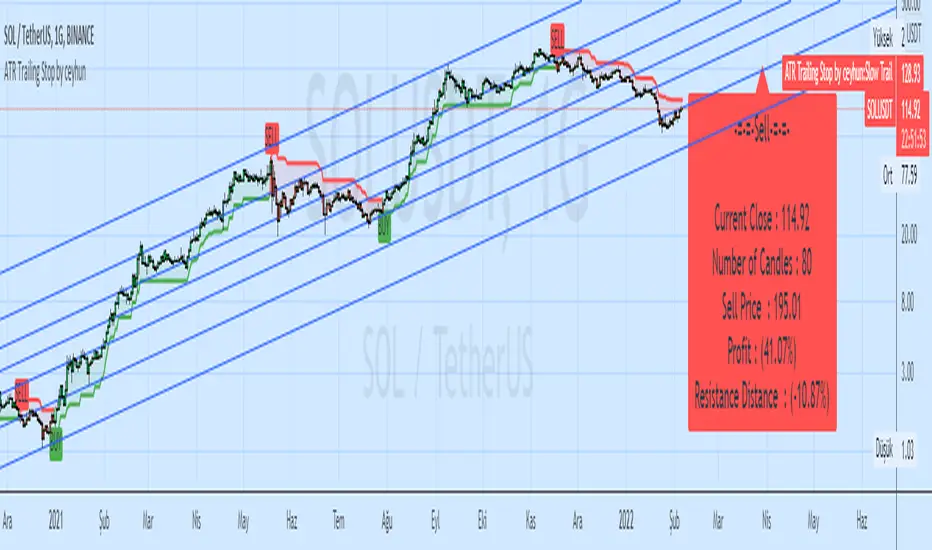
Same coding only coloring and information panel was added.
CDC ATR Trailing Stop V2.1 (2013)

//Barcolor
Green = Trail1 > Trail2 and close > Trail2 and low > Trail2
Blue = Trail1 > Trail2 and close > Trail2 and low < Trail2
Red = Trail2 > Trail1 and close < Trail2 and high < Trail2
Yellow = Trail2 > Trail1 and close < Trail2 and high > Trail2
//It gives White color where there is deterioration.
//InfoPanel
Buy Price = Blue draws the circles at the purchase price.
Profit Long>20 = Risk level taken as a percentage, I got the highest 20%, you can determine as you wish.
Sell Price = Red draws the circles at the purchase price.
Profit Short>20 = Risk level taken as a percentage, I got the highest 20%, you can determine as you wish.

CDC ATR Trailing Stop V2.1 (2013)
//Barcolor
Green = Trail1 > Trail2 and close > Trail2 and low > Trail2
Blue = Trail1 > Trail2 and close > Trail2 and low < Trail2
Red = Trail2 > Trail1 and close < Trail2 and high < Trail2
Yellow = Trail2 > Trail1 and close < Trail2 and high > Trail2
//It gives White color where there is deterioration.
//InfoPanel
Buy Price = Blue draws the circles at the purchase price.
Profit Long>20 = Risk level taken as a percentage, I got the highest 20%, you can determine as you wish.
Sell Price = Red draws the circles at the purchase price.
Profit Short>20 = Risk level taken as a percentage, I got the highest 20%, you can determine as you wish.
הערות שחרור
bugs fixedהערות שחרור
info panel fixהערות שחרור
bugs fixהערות שחרור
fixהערות שחרור
fixPeriod and Support-Resistance Distance
הערות שחרור
fixהערות שחרור
v5 fixסקריפט קוד פתוח
ברוח האמיתית של TradingView, יוצר הסקריפט הזה הפך אותו לקוד פתוח, כך שסוחרים יוכלו לעיין בו ולאמת את פעולתו. כל הכבוד למחבר! אמנם ניתן להשתמש בו בחינם, אך זכור כי פרסום חוזר של הקוד כפוף ל־כללי הבית שלנו.
כתב ויתור
המידע והפרסומים אינם מיועדים להיות, ואינם מהווים, ייעוץ או המלצה פיננסית, השקעתית, מסחרית או מכל סוג אחר המסופקת או מאושרת על ידי TradingView. קרא עוד ב־תנאי השימוש.
סקריפט קוד פתוח
ברוח האמיתית של TradingView, יוצר הסקריפט הזה הפך אותו לקוד פתוח, כך שסוחרים יוכלו לעיין בו ולאמת את פעולתו. כל הכבוד למחבר! אמנם ניתן להשתמש בו בחינם, אך זכור כי פרסום חוזר של הקוד כפוף ל־כללי הבית שלנו.
כתב ויתור
המידע והפרסומים אינם מיועדים להיות, ואינם מהווים, ייעוץ או המלצה פיננסית, השקעתית, מסחרית או מכל סוג אחר המסופקת או מאושרת על ידי TradingView. קרא עוד ב־תנאי השימוש.