OPEN-SOURCE SCRIPT
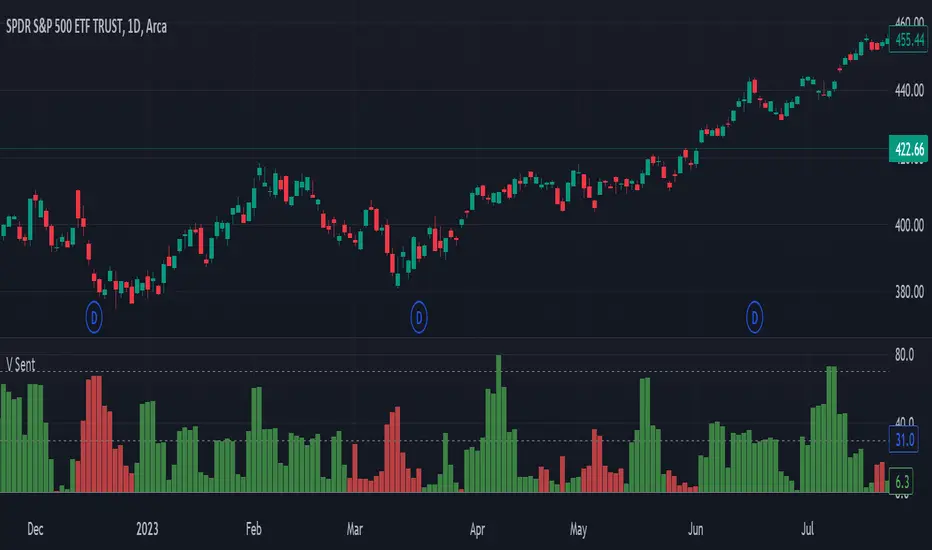
Volume Sentiment

In 1994 Tushar Chande and Stanley Kroll published a epic book of modern trading indicators called "The New Technical Trader". I highly recommend it. Two indicators that stood out was the Market Thrust and Thrust Oscillator. They suggested these as alternatives to the Arms Index. Rather than using the Advancing Stocks and their associated volume, I applied their logic to individual bars.
Bar Sentiment can be defined and the difference between the low and the close relative to the bar width. Smaller values are bearish and larger one are bullish. A bullish candle would close above its mid-point. Conversely, a close below the candle mid-point is considered bearish.
With that, this script sums the bullish or bearish (as defined above) volume over a user defined number of bars. It gives a unique indication of the volume compared to typical volume indicators. It also gives the user the option to set a "High Volume" alert when the total volume is greater than the moving average. This is helpful for identify increasing activity in your security.
Enjoy and happy trading!
סקריפט קוד פתוח
ברוח האמיתית של TradingView, יוצר הסקריפט הזה הפך אותו לקוד פתוח, כך שסוחרים יוכלו לעיין בו ולאמת את פעולתו. כל הכבוד למחבר! אמנם ניתן להשתמש בו בחינם, אך זכור כי פרסום חוזר של הקוד כפוף ל־כללי הבית שלנו.
כתב ויתור
המידע והפרסומים אינם מיועדים להיות, ואינם מהווים, ייעוץ או המלצה פיננסית, השקעתית, מסחרית או מכל סוג אחר המסופקת או מאושרת על ידי TradingView. קרא עוד ב־תנאי השימוש.