OPEN-SOURCE SCRIPT
Seasonality with Custom Interval
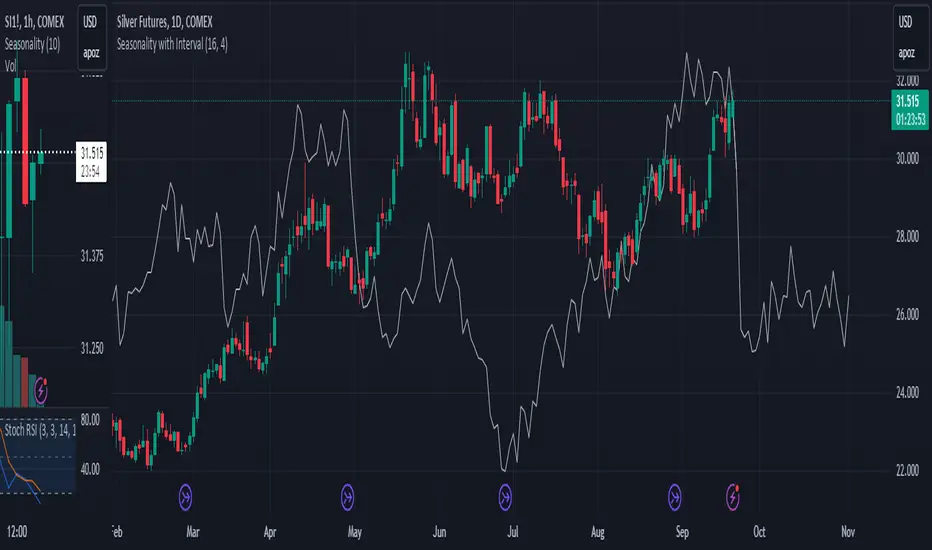
Seasonality with Custom Interval Lookback [Modified]
by TradersPod
Description:
This script is a modified version of Kaschko's original Seasonal Trend with Interval Lookback indicator, designed to help traders analyze seasonal trends over customizable intervals. The modifications in this version provide enhanced flexibility and improved visualization, making it a valuable tool for analyzing seasonal patterns in various markets.
Key Features:
1. Custom Lookback Multiplier: The script allows users to adjust the lookback period with a multiplier, giving more control over the number of years analyzed for seasonality. This feature is especially useful for traders looking to tailor the analysis based on different market cycles or election cycles.
2. Enhanced Visualization: Users can customize the color and line width of the plotted seasonality line for better readability. The smoothing parameter has been added to allow for flexible moving averages, reducing noise in the trend visualization.
3 Detailed Chart Plotting: The script plots the trading week of the year (TWOY), trading day of the month (TDOM), and trading day of the year (TDOY) on the status line, providing users with additional insights into how seasonal trends affect price movements.
How to Use:
1. Lookback Period: Set the number of years to look back. For example, if you set it to 16 years, the script will gather data from the last 16 years.
2. Interval Years: You can set an interval (e.g., 4 years for U.S. elections) to focus on specific years:
Interval = 0: This setting will use all years within the lookback period.
Interval > 0: This setting will use only every nth year, based on the interval you set (e.g., 4 for U.S. elections, 10 for decennial years).
3 Future Projections: You can specify how many bars into the future the script should project the seasonal trend.
Example Settings:
>Lookback Period: 16 years.
>Interval: 4 years (this would focus on U.S. election years).
>]Future Projections: 30 bars (the seasonal trend is projected 30 bars into the future).
Intended Use: This indicator is ideal for traders who:
>Want to analyze how market prices react to seasonal cycles.
>Need flexible, customizable tools for tracking longer-term trends.
>Prefer visual clarity in their seasonal trend analysis with adjustable settings for better readability.
How It Works:
>The script calculates the average price change for each trading day, week, or month, using a lookback period of up to 30 years. It then smooths the seasonal trend using a customizable moving average and projects the trend into the future, allowing users to forecast potential price movements based on historical seasonal patterns.
>The script also offers a projection of future seasonality by plotting the seasonal trend up to 252 bars into the future, with options to offset the start of the seasonality.
Notes:
>This script is open-source under the Mozilla Public License 2.0.
>Original script by Kaschko. Modifications by TradersPod.
סקריפט קוד פתוח
ברוח האמיתית של TradingView, יוצר הסקריפט הזה הפך אותו לקוד פתוח, כך שסוחרים יוכלו לעיין בו ולאמת את פעולתו. כל הכבוד למחבר! אמנם ניתן להשתמש בו בחינם, אך זכור כי פרסום חוזר של הקוד כפוף ל־כללי הבית שלנו.
כתב ויתור
המידע והפרסומים אינם מיועדים להיות, ואינם מהווים, ייעוץ או המלצה פיננסית, השקעתית, מסחרית או מכל סוג אחר המסופקת או מאושרת על ידי TradingView. קרא עוד ב־תנאי השימוש.